Rapid detection of the physicochemical properties of honey based on infrared spectroscopy
-
摘要:
该论文以116个蜂蜜样品为对象,考察蜂蜜理化指标间的相关性,并采用红外光谱技术结合偏最小二乘回归法建立快速定量模型,探讨模型对蜂蜜理化性质指标的定量能力,比较近、中红外光谱在定量检测中的能力,从数据层融合角度考究光谱融合对定量精度的提升。主要研究结果如下:蜂蜜的部分理化性质间具相互关联性,色差、电导率和pH两两呈正相关,pH 值和可滴定酸,水分与黏度之间彼此呈负相关;近红外光谱技术(near-infrared spectrum,NIR)和中红外光谱技术(mid-infrared spectrum,MIR)对果糖、葡萄糖、还原糖、果糖/葡萄糖、水分、黏度、pH值和色差具有良好的定量分析能力(R2>0.9),对电导率、蔗糖、麦芽糖和可滴定酸的精度和模型相关系数尚可接受;二者单独对淀粉酶值、脯氨酸的定量结果较差,通过数据融合后,脯氨酸精度有所提升(较正集rc 0.825,验证集rp 0.664,较正集RMSEC 38.68 mg/kg,验证集RMSEP 49.57 mg/kg),淀粉酶值无优化(rc 0.799 mg/kg,rp 0.695 mg/kg,RMSEC 2.57 mL/(g·h),RMSEP 3.02 mL/(g·h))。MIR对糖的定量分析精度略优于NIR。研究证明将近、中红外光谱用于蜂蜜部分理化指标的快速定量是可行的。
Abstract:Taking 116 honey samples as the research object, this study aims to rapidly detect the physicochemical properties of honey using infrared spectroscopy. The physicochemical properties of honey samples were determined, including the carbohydrate (fructose, glucose, sucrose, maltose, and lactose), moisture content, titration acidity, pH, electrical conductivity, viscosity, amylase value, HMF, proline, and color (L*a*b*). Principal component analysis (PCA) was implemented to explore the correlation among various physicochemical indexes of honey. Near Infrared spectrum (NIR) and mid-infrared spectrum (MIR) were used to obtain the three-dimensional information of "compound, aroma and taste" of honey samples. The Partial least squares (PLS) models were established using physicochemical indexes after NIR and MIR. Correlation coefficient (R2) and predictive root mean square error (RMSEP) were used to evaluate the quantitative accuracy of NIR and MIR indexes. The quantitative analysis of physicochemical properties was also implemented to compare the quality evaluation. Proline and amylase values were taken as the indicators, in order to clarify the effects of spectral technology fusion on the quantitative analysis at the level of information source (data) fusion. The results showed that there was a positive correlation between the color (L*a*b*), electrical conductivity, and pH, indicating the high mineral content with the deeper color and the higher conductivity value. A negative correlation between pH and titration acidity, namely the pH was low, while the titration acidity was high in honey. There was also a negative correlation between the water content and viscosity. The lower the water content of honey was, the higher the viscosity was. some indexes of honey were interrelated as well. The NIR and MIR models were established with the excellent ability of quantitative analysis for the fructose, glucose, reducing sugar, fructose/glucose, water content, viscosity, pH, and color (L*a*b*) (R2>0.9). The R2 and SEP of the model were acceptable for the electrical conductivity, sucrose, maltose, and titration acidity, indicating better precision in the rapid quantitative analysis. There was a low quantitative accuracy of amylase value content, proline, and HMF. There was a low accuracy of the improved model for the amylase value, proline, and HMF after the rapid quantitative analysis. The indexed with the higher prediction accuracy of NIR were ranked as fructose(R2=0.908), sucrose(R2=0.906), water content(R2=0.975), electrical conductivity(R2=0.935), viscosity(R2=0.949), and pH(R2=0.947). The indexes with the higher accuracy of MIR prediction were the glucose(R2=0.813), maltose(R2=0.798), reducing sugar(R2=0.711), fructose/glucose(R2=0.942), titration acidity(R2=0.890), amylase value(R2=0.641) and Color, L*a*b*. The Rc of the proline quantitative model increased from 0.614 to 0.825, whereas the RMSEP decreased from 54.95 to 49.57 mL/(g·h) after the fusion of NIR and MIR in the data layer. The quantitative model of amylase value was not optimized during this time. From the perspective of instruments, accessories, and spectral acquisition, the ATR accessories used for the MIR spectral acquisition were large and expensive, particularly only limited to laboratory use. The NIR can be expected for the practical application of rapid detection of honey quality under comprehensive conditions. Therefore, it is feasible for the NIR and MIR to rapidly quantify some physical and chemical indexes of honey. Data fusion can posed a positive impact on the prediction model in the implementation process.
-
Keywords:
- NIR /
- rapid detection /
- MIR /
- honey /
- partial least square regression /
- quantitative analysis
-
0. 引 言
蜂蜜是蜜蜂采集植物的花蜜、分泌物或蜜露,与自身分泌物结合后,经充分酿造而成的天然甜味物质[1],深受大众喜爱[2]。蜂蜜中的糖类(占75%左右,其中果糖和葡萄糖含量在65%以上)、溶菌酶等物质赋予蜂蜜较好的抗菌活性[3-4];多种抗氧化因子使其具有较好的抗氧化性,是一种潜在的天然抗氧化剂[5];氨基酸、维生素、矿物质、酶、酚类等丰富物质,使其具有抗炎、免疫调节、调节血糖、调节肠道微生物等多种功能活性[6-8]。
蜂蜜中各成分的含量和种类会因花蜜的种类和地理位置不同产生差异[9],根据产品功效而选择某中成分含量较高的蜂蜜品种,不但能节约生产成本,也能极好的保证产品的功能性[10-12]。因此,研究蜂蜜中各理化指标间的相关性和各成分快速定量检测,对蜂蜜的实际生产和蜂蜜产业的发展具有重要意义。
蜂蜜理化性质定量分析通用的国际标准检测技术包括化学法、分光光度法、GC[13],可以准确得到蜂蜜各组分的含量,但步骤繁琐、耗时耗力且成本较高,难以及时、原位、快速、全面的满足蜂蜜中主要成分的含量快速测定。
红外光谱技术是一种快速、绿色环保的分析技术,根据频率范围的不同,又可分为近红外光谱技术(near-infrared spectrum,NIR)和中红外光谱技术(mid-infrared spectrum,MIR)[14]。国内、外利用近红外光谱技术分析蜂蜜中组分含量的基础性研究较多,LI等[15]利用近红红外技术对蜂蜜的水分含量建立PLS定量分析模型,模型准确性较好。APRICENO等[16]研究表明近红外光谱-化学计量方法可用于蜂蜜中5-羟甲基糠醛(HMF)的快速定量分析。丁家欣等[17]采用近红外光谱建立了蜂蜜中的葡萄糖和果糖定量分析模型。MIR定量蜂蜜物质的相关研究较少,LI等[18]将CNN与 MIR相结合并用于蜂蜜的快速掺假鉴别。ÖZBAY等[19]将MIR方法与化学计量学相结合,研究表明MIR可用于估计糖浆掺假量的水平。关于MIR在蜂蜜检测中的应用研究有待进一步拓展。在现有研究中,对NIR和MIR的定量能力进行比较并将二者融合应用于定量分析的研究较少,对此本文开展了相关研究。
本研究以蜂蜜为对象,采用国际通用检测方法对蜂蜜各理化指标进行测定,并用主成分分析(principal component analysis,PCA)[20]考察指标间的相关性,采用红外光谱技术结合偏最小二乘回归(partial least square regression,PLSR)分析方法[21],建立蜂蜜中理化性质的 PLS定量分析模型,将NIR和MIR进行比较和融合,探究模型对蜂蜜组分的定量能力,考察融合近、中红外光谱信息对蜂蜜理化指标定量精度的提升效果。
1. 材料与方法
1.1 试剂与材料
蜂蜜(共116个样品,其中荆花蜜39个,枣花蜜27个,洋槐蜜37个,油菜蜜13个)由北京百花蜂业科技发展股份公司采集;糖标准品,Sigma-Aldrich中国公司;碘,天津市大茂化学试剂厂;乙酸钠,北京化学试剂公司;可溶性淀粉,北京奥博星生物技术有限责任公司;冰乙酸,北京化工厂;氯化钠、甲酸、异丙酮、茚三酮、乙二醇甲醚、邻苯二甲酸氢钾、氢氧化钠、碘化钾,分析纯,国药集团化学试剂北京有限公司;5-羟甲基糠醛(纯度99%),Sigma公司;甲醇、乙腈,色谱纯,西陇化工股份有限公司;脯氨酸标准品,纯度≥99%,Sigma-Aldrich中国公司;实验室自制超纯水。
1.2 仪器和设备
傅里叶变换近红外光谱仪,德国布鲁克公司;傅里叶变换红外光谱仪,美国Perkin Elmer公司;色谱柱YMC-Pack Polyamine Ⅱ;Venusil XBP-C18色谱柱,博纳艾杰尔科技有限公司;WAY-2S型数字阿贝折光仪,上海精密科学仪器有限公司;HX-
1050 恒温循环器,北京德天佑科技发展有限公司;842型自动电位滴定仪,瑞士万通公司;pH计,PB-10,Sartorius;Orion 5-Star台式多参数测量仪;流变仪,美国TA公司;T6新世纪紫外可见分光光度计,北京普析通用仪器有限责任公司;恒温水浴锅,北京长安科学仪器厂;LC-20A高效液相色谱仪,配有LC-20AT洗脱泵、SPD-20A检测器、CTO-20A柱温箱 LC Solution工作站,岛津国际贸易有限公司;水系滤膜,0.45 µm,博纳艾杰尔科技有限公司;恒温水浴锅,北京长安科学仪器厂;Hunterlab Colorquest XE台式分光测色仪,美国 Hunter Lab公司;电子分析天平,感量0.001 g,Sartorius,BS223S。1.3 试验方法
1.3.1 样品采集及前处理
采集样品种类包括荆花蜜、枣花蜜、洋槐蜜和油菜蜜。采集由北京百花蜂业科技发展股份公司完成,每个养蜂厂选取1~2个蜂群,每个样品采集1 kg,采集的样品直接装瓶。采集样品于实验室进行过滤处理。
1.3.2 蜂蜜理化性质分析
共检测了4种蜂蜜116个蜂蜜样品的上述指标,所采用的检测方法为国际标准中的通用方法和通用仪器[22-24],结合试验过程中的问题,对部分方法进行了改进。
葡萄糖、果糖、蔗糖和麦芽糖:参照《蜂蜜中果糖、葡萄糖、蔗糖、麦芽糖含量的测定方法—液相色谱示差折光检测法》[25],进行了适当修改。
色谱柱温度,25 ˚C;进样量,20 µL;分析时间,25 min;体积流量,1 mL/min。
水分:采用折光法,参照国际蜂蜜委员会的方法[24]和中国进出口蜂蜜检验方法[26];酸度:参照IHC的方法[24]和国标中的方法[26];电导率:参照GB/T
18932.15 -2003中的方法[27],使用实验室自制超纯水稀释蜂蜜,电阻率18.2 MΩ·cm。淀粉酶值:参照了国标[28]方法;5-羟甲基糠醛(5-hydroxymethylfurfural,HMF):参照GB/T18932.18 -2003[29];脯氨酸:采用分光光度法,参照标准SN/T 0850-2000[30];pH值: 称量(20±0.001) g蜂蜜样品,用超纯水溶解并稀释,定容至100 mL容量瓶,用pH计测定;黏度:用流变仪测定;色差用Hunterlab Colorquest XE台式分光测色仪测定。
数据处理:计算全部样品和不同品种蜂蜜的平均值和标准偏差,对平均值进行了方差分析。对全部理化指标数据结果进行了主成分分析,考察指标间的相关性。数据分析和绘图软件使用OriginPro 8.6和Excel 2017等。
1.3.3 红外光谱检测及PLSR定量模型的建立
1)光谱采集
近红外光谱:为消除样品温度的影响,检测样品提前一天与仪器放于同一环境下,环境温度为室温25~26 °C。测量样品前进行仪器的自检,并记录空气背景,测样过程中每隔1 h扫描背景一次,软件自动扣除背景。采用MPA傅里叶变换近红外光谱仪,仪器的光学配置:NIR液体光纤探头,分束器Quartz,检测器TE-InGaA。光谱采集选用透射模式,光谱扫描波数范围为10 000~4 000 cm−1,以空气为参比,光程为2 mm,分辨率为8 cm−1,扫描速度10 kHz,背景扫描64次,样品扫描64次。
中红外光谱:将检测样品提前一天与仪器放于同一环境下,环境温度为室温23~25 °C。测量过程中使用无水乙醇对样品进行擦洗,考虑到乙醇挥发可能对样品盘温度的影响,每次添加样品后,稳定30 s再进行光谱测量。采用傅里叶变换红外光谱仪,仪器的光学配置:铟镓砷(InGaAs)检测器;Crystals Diamond/ZnSe;ATR附件;光谱扫描范围4 000~500 cm−1,采集吸光度,扫描次数4,分辨率4 cm−1;以空气为参比,并记录空气背景,测样过程中每隔0.5 h扫描背景一次,软件自动扣除背景。
2)近、中红外光谱技术比较和融合
比较近、中红外光谱技术对蜂蜜组分的定量能力。针对脯氨酸和淀粉酶含量,绘制红外光谱平局融合谱图,考察是否能通过融合近、中红外光谱信息,提升对这两个指标的定量精度。因融合光谱的数据繁多,采用遗传算法(genetic algorithms, GA)[31]进行变量筛选,从大量的原始光谱数据中,提取出有效的变量;采用融合光谱对淀粉酶值和脯氨酸均进行了遗传偏最小二乘回归(genetic algorithms partial least squares regression,GAPLS),直接在Matlab中调用,最大进化代数设置为100,以累计贡献率(CV)和交叉验证均方根误差(root mean square error of cross validation,RMSECV)为指标确定要选择的变量个数。
3)数据处理
先对光谱数据进行预处理、异常样品的剔除。预处理的方法包括:平滑、标准归一化、多元散射校正、导数处理、中心化,一种或多种方法结合。通过杠杆值和学生化残差值,剔除光谱异常值和化学值异常值。以全光谱建立各指标的偏最小二乘回归(PLSR)定量模型,其中,以RMSECV和RMSEC为参考选取主成分个数。 数据分析采用Matlab 7.8.0软件,利用OriginPro 8.6等软件进行图像绘制。
2. 结果与分析
2.1 蜂蜜理化性质数据
对采集的蜂蜜样品的各项指标进行常规方法检测,得到全部蜂蜜样品中各组分的含量数据,计算全部样品和不同品种蜂蜜的平均值和标准偏差,并对平均值进行了方差分析,详见表1。所得数据可用于辅助判断所建立的PLSR定量模型的精确性。
表 1 全部蜂蜜样品的物理化学指标检测结果描述Table 1. Physical and chemical indicators description of all the honey samples理化指标
Physicochemical index样本数
Sample number平均值
Average value标准偏差
Standard deviation最小值
Minimum value最大值
Maximum value果糖Fructose F/(g·(100 mL)−1) 116 39.546 4.776 19.634 47.000 葡萄糖Glucose G/(g·(100 mL)−1) 116 28.909 3.834 1.559 34.551 蔗糖Sucrose S/(g·(100 mL)−1) 116 1.487 0.719 0.329 4.402 麦芽糖Maltose M/(g·(100 mL)−1) 116 1.443 0.545 0.403 2.888 还原糖Reducing sugar RS/(g·(100 mL)−1) 116 69.89 7.51 21.97 78.83 果糖/葡萄糖Fructose/glucose F/G 116 1.469 1.057 0.958 12.590 淀粉酶值Diastase number DN/(mL·(g·h)−1) 115 15.32 5.25 5.59 26.90 羟甲基糠醛 HMF/(mg·kg−1) 118 0.749 0.597 − 2.607 电导率Electrical conductivity EC/(μS·cm−1) 118 265.11 185.39 100 708 pH值 pH value 118 4.43 1.34 3.46 7.22 水分Water content WC/(%) 118 21.94 3.274 16.940 31.768 可滴定酸Titration acidity TA/(mg·(100 g)−1) 118 15.097 7.584 3.347 34.886 黏度Viscosity V/(Pa·s) 118 3.724 3.180 0.254 16.455 脯氨酸Proline P/(mg·kg−1) 118 293.96 98.09 112 500 色差L* Color L* 115 95.29 1.13 92.10 96.53 色差a* Color a* 115 −0.358 0.318 −1.260 0.100 色差b* Color b* 115 3.356 3.519 0.363 13.165 样本糖含量特征与文献报道和国内外蜂蜜标准描述相符[13, 16]。比较文献结果发现,本试验采集的蜂蜜样品糖含量指标正常,果糖和葡萄糖含量率高于文献结果,蔗糖和麦芽糖含量相近,且稍低于文献结果。与文献中的结果相比,电导率指标正常(小于800 μS/cm);pH值范围正常(4左右);水分含量偏高,文献数据在17~18%左右,国标中规定蜂蜜一级品≤20、二级品≤24,本试验样本总体偏高(21.94),且4个蜜种中油菜蜜水分含量达到28,这主要是与本试验采集的是原料蜂蜜有关,其次采蜜时期北方地区降雨频繁;全部样品淀粉酶值平均值为15.324 mL /(g·h),高于GB14963-2011中的规定和文献中的数值,表明本试验采集的蜂蜜样品较新鲜。HMF是美拉德反应和焦糖化反应的指示产物,形成于蜂蜜的储藏过程中,允许存在,但应当50 mg/kg[13,32]。HMF的含量结果说明本试验采集的蜂蜜品质较高,新鲜度好。脯氨酸可以反映出蜂蜜整体的氨基酸含量,并与蜂蜜的抗氧化性能有关[33]。
2.2. 主成分分析结果
对全部理化指标数据结果进行主成分分析。通过对数据进行降维,提取较少的主成分,全面考察蜂蜜各指标间是否相互影响,具有相关性。表2为全部理化指标结果的相关系数矩阵,相关系数为1,表示完全正相关,为−1,表示完全负相关,为0表示完全不相关。表中可以看出,色差结果、电导率和pH值,三者之间,两两相关性较高,有研究人员指出了矿物质含量高的蜂蜜颜色较深,其电导率值也会偏高[34]。
表 2 理化指标间的相关系数矩阵Table 2. Correlation matrixes of physical and chemical indicators指标
IndicatorpH WC TA V P L* a* b* F G S M F/G RS HMF DN EC 0.97 −0.50 −0.67 0.63 0.39 −0.91 -0.94 0.95 −0.19 −0.29 0.57 −0.17 0.04 −0.30 −0.60 0.61 pH 1.00 −0.51 −0.79 0.60 0.35 −0.86 −0.96 0.92 −0.13 −0.39 0.64 −0.24 0.17 −0.31 −0.65 0.52 WC 1.00 0.59 −0.80 −0.52 0.57 0.51 −0.47 −0.42 −0.16 −0.61 −0.43 −0.25 −0.42 −0.06 −0.58 TA 1.00 −0.47 −0.25 0.55 0.78 −0.61 −0.28 0.43 −0.67 0.27 −0.54 0.03 0.45 −0.32 V 1.00 0.40 −0.65 −0.60 0.61 0.05 0.08 0.50 0.31 −0.01 0.10 −0.08 0.58 P 1.00 −0.52 −0.30 0.43 0.11 0.28 0.37 0.45 −0.10 0.26 0.07 0.62 L* 1.00 0.81 −0.97 0.17 0.10 −0.52 −0.05 0.07 0.17 0.44 −0.64 a* 1.00 −0.89 0.12 0.40 −0.63 0.27 −0.18 0.31 0.59 −0.48 b* 1.00 −0.24 −0.26 0.55 −0.12 −0.02 −0.32 −0.56 0.57 F 1.00 0.18 0.31 0.23 0.71 0.84 0.20 0.03 G 1.00 −0.29 0.68 −0.57 0.68 0.43 0.16 A 1.00 0.14 0.47 0.10 −0.26 0.35 M 1.00 −0.28 0.60 0.56 0.29 F/G 1.00 0.21 −0.14 −0.09 RS 1.00 0.41 0.13 HMF 1.00 −0.04 pH值和可滴定酸呈现明显的负相关,pH值越低,可滴定酸度越高。水分含量与黏度呈明显负相关,水分含量越少,蜂蜜黏度越高。
2.3 蜂蜜原始光谱图
2.3.1 近红外光谱图
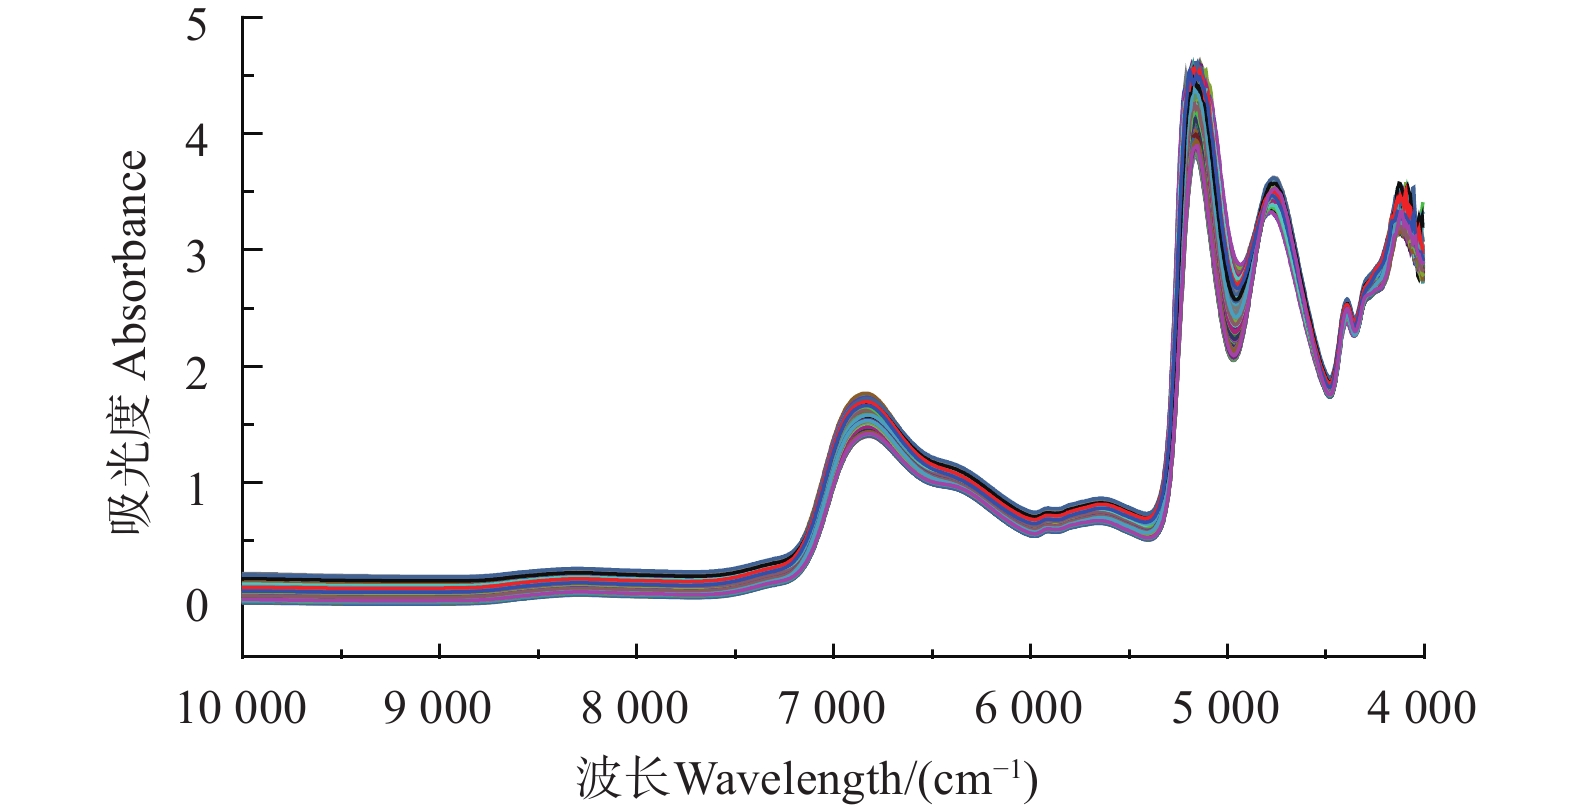
记录样品吸光度图谱,得到的全部蜂蜜样品近红外谱。由图1可知,不同蜂蜜样品,因品种、颜色等不同,NIR图存在差异,曲线趋势整体一致。
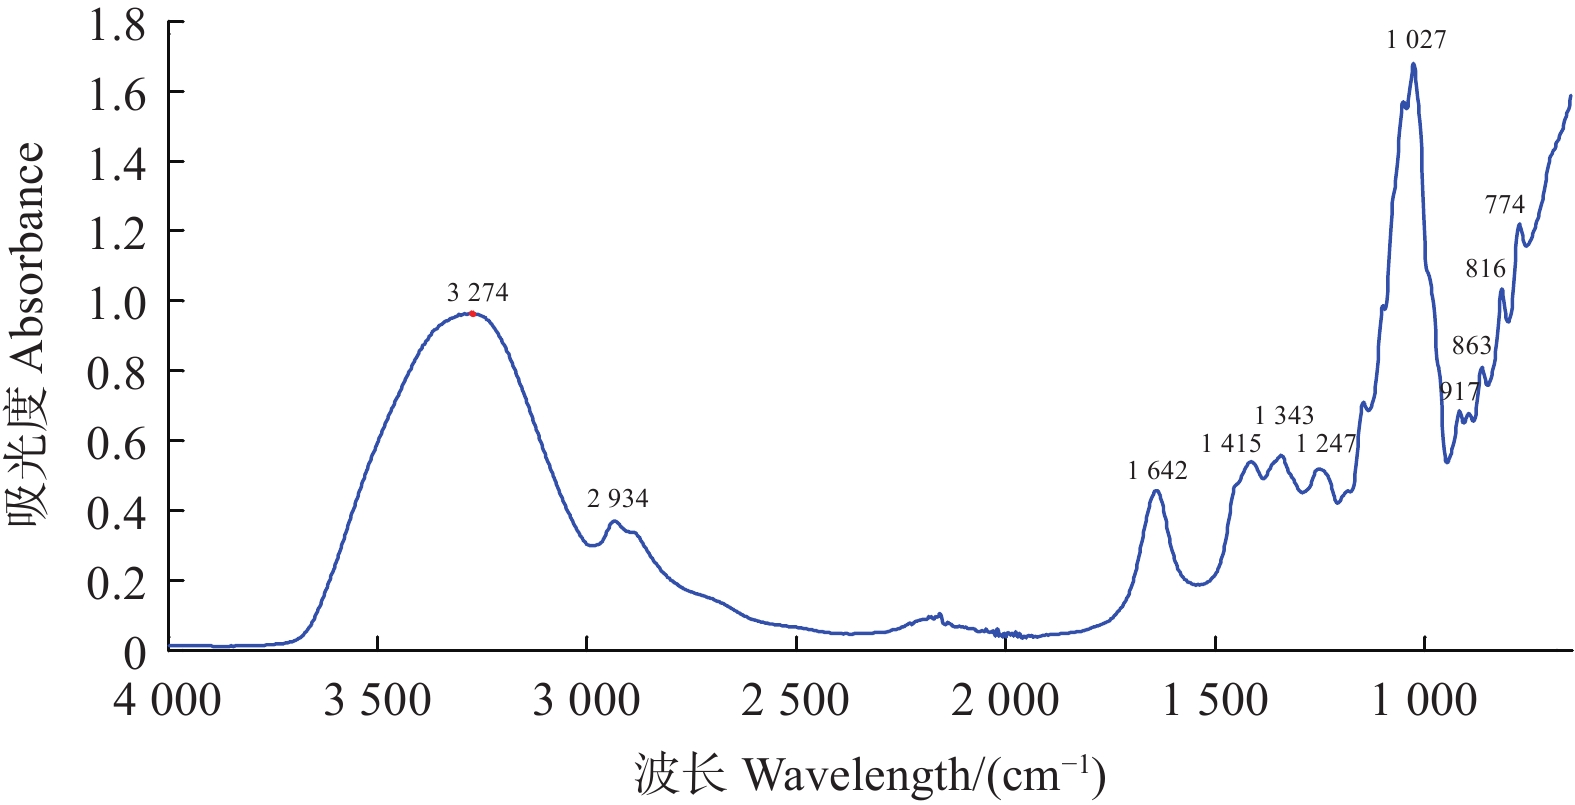
2.3.2 中红外光谱图
全部样品的中红外光平均值谱图见图2。观察图2,MIR光谱图中的吸收峰个数较NIR多,2 000 cm−1附近出现了明显的噪声信息,光谱信息集中在1 600~750 、1 450~800 cm−1光谱区间主要反映了果糖、葡萄糖和蔗糖的光谱吸收,其中900~750 cm−1为糖的特异吸收区间。1 153~904 cm−1附近的吸收为C-O和 C-C的伸缩振动,1 474~1 199 cm−1附近的吸收来自于O-C-H、C-C-H和 C-O-H的弯曲振动,2 934 cm−1附近的吸收峰被认为与氨基酸的吸收有关[35]。
2.4 红外光谱定量检测
2.4.1 近红外光谱PLSR模型
建立了17个指标的PLSR模型,模型的优化过程没有展示,表3为本试验得到的PLSR优化模型结果。各理化指标的模型预测值(NIR)和真实测量值散点图如图3、4所示。
表 3 蜂蜜理化指标近红外光谱检测的偏最小二乘回归结果Table 3. PLSR model results for physical and chemical indicators determined by FT-NIR测定指标
Measurand主成分个数
Number of principal components PCs预处理方式
Pre-processing mode数据集
Date set样本数
Simple sizeR2 均方根误差
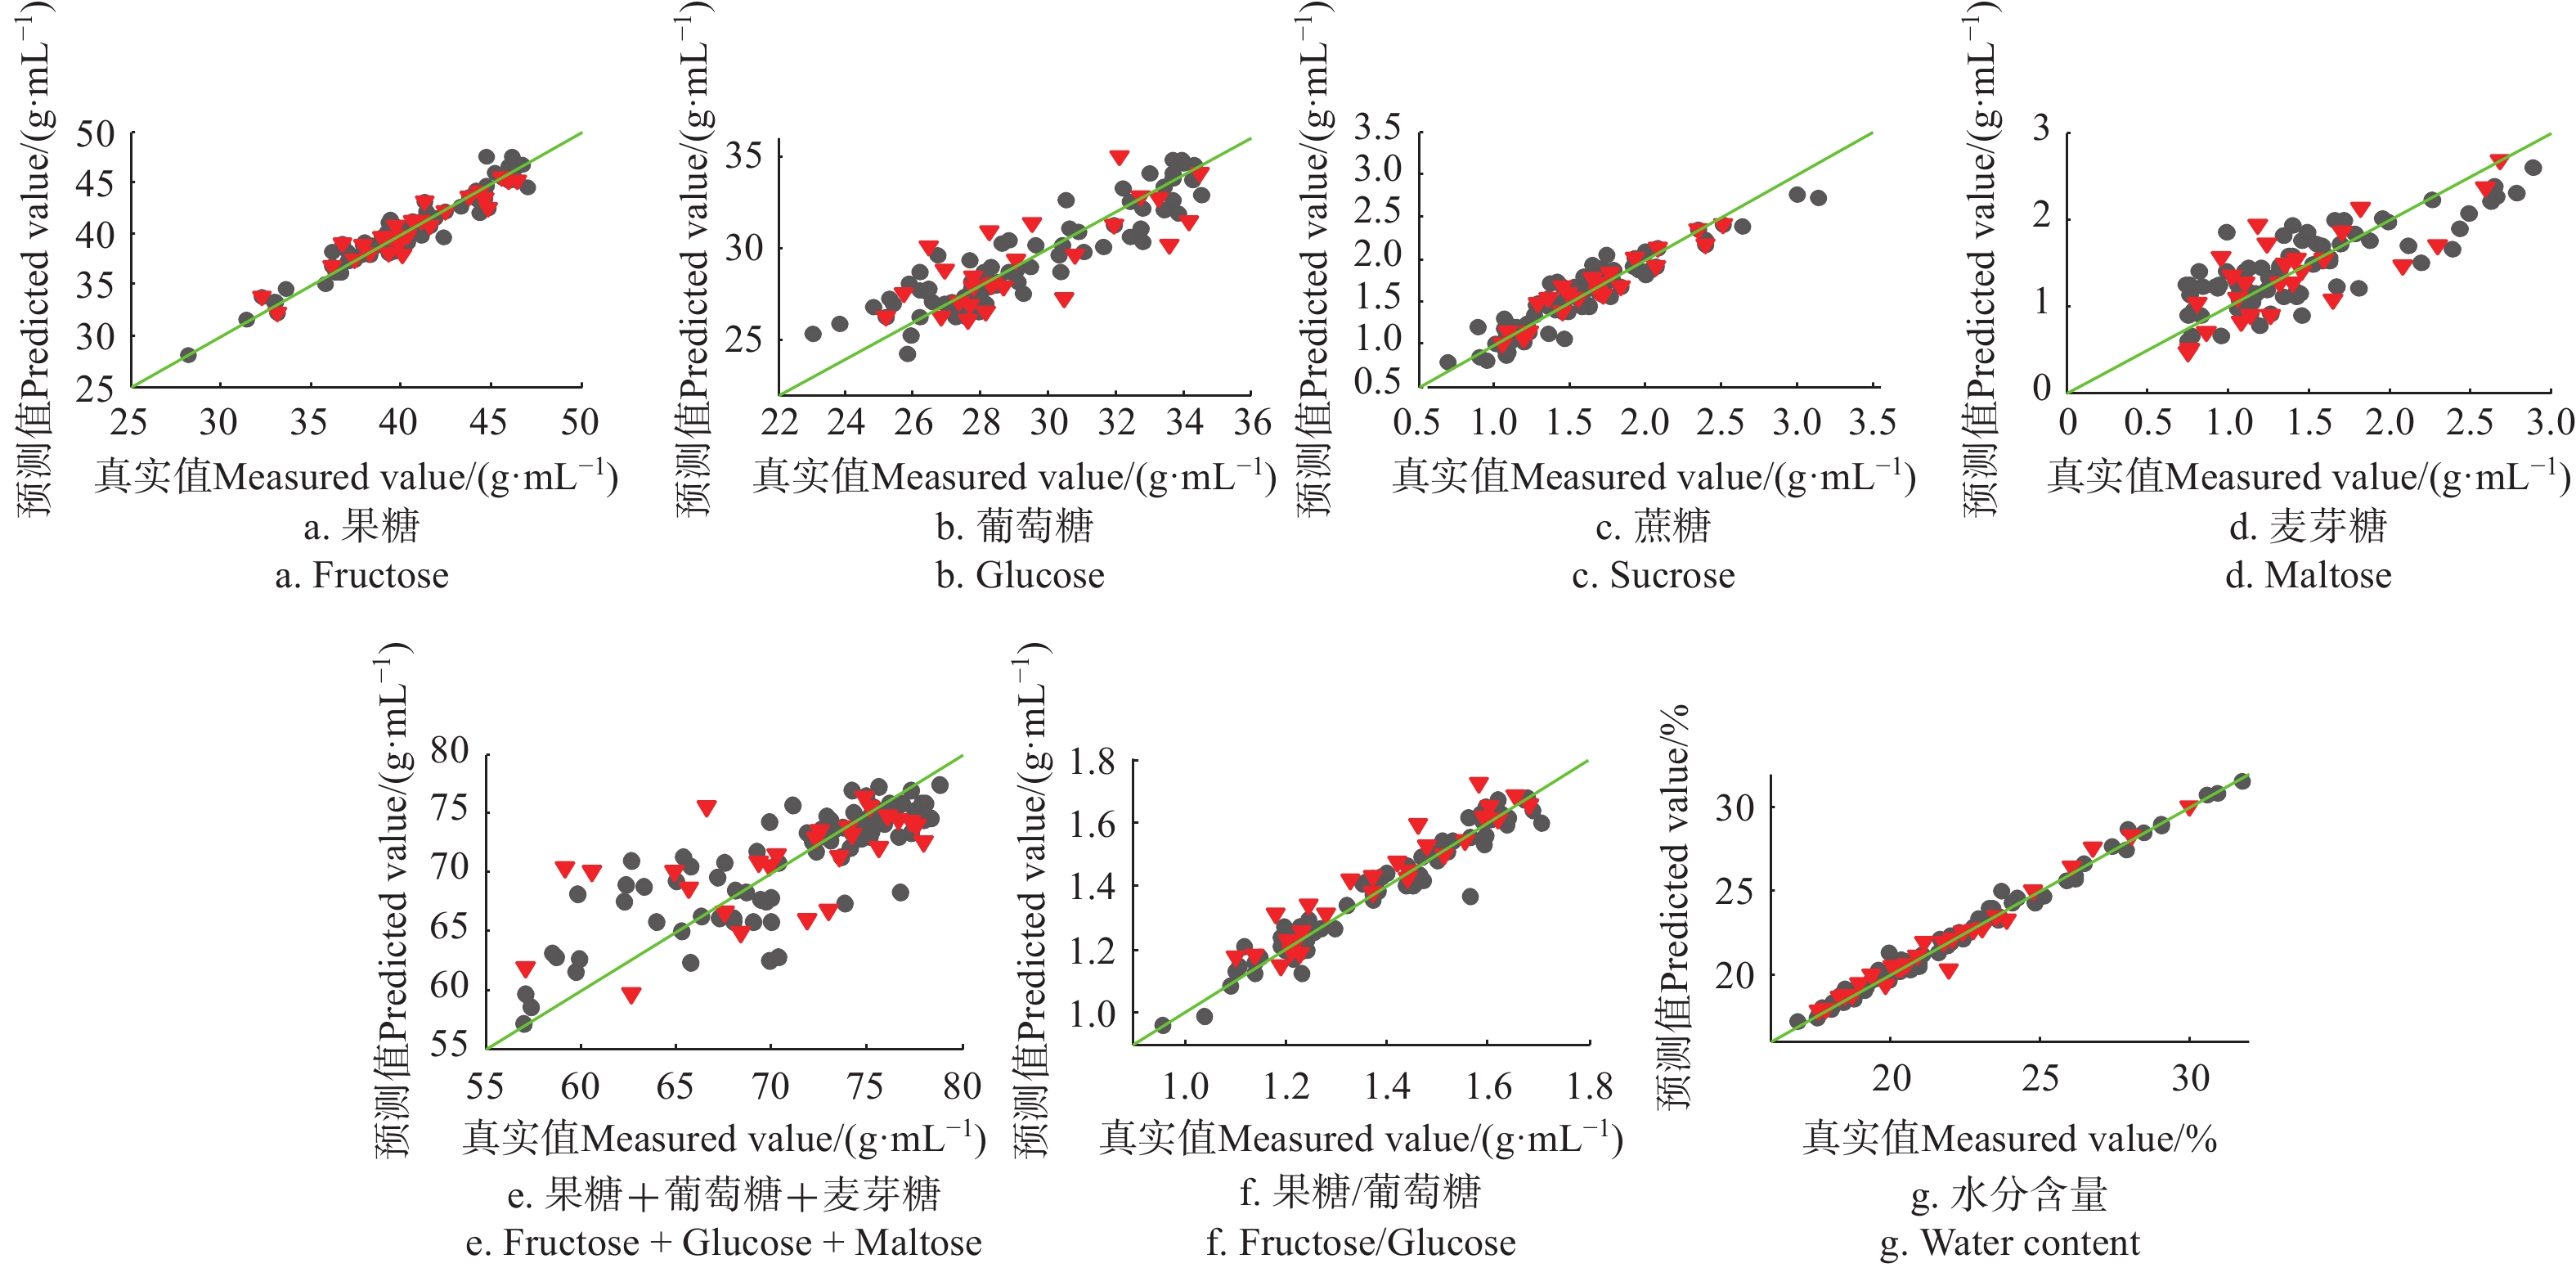
RMSE(C/P)果糖Fructose 13 SNV Cal 78 0.931 1.042(g·(100 mL)−1) Val 26 0.908 1.123(g·(100 mL)−1) 葡萄糖Glucose 9 SNV Cal 79 0.854 1.092(g·(100 mL)−1) Val 26 0.695 1.559(g·(100 mL)−1) 蔗糖Sucrose 13 2nd D(5, 5)+SNV Cal 76 0.883 0.157(g·(100 mL)−1) Val 25 0.906 0.126(g·(100 mL)−1) 麦芽糖Maltose 5 SNV Cal 77 0.642 0.320(g·(100 mL)−1) Val 26 0.612 0.346(g·(100 mL)−1) 还原糖Reducing sugar 4 SG(7, 3)+SNV Cal 82 0.688 3.243(g·(100 mL)−1) Val 27 0.414 3.742(g·(100 mL)−1) 果糖/葡萄糖 7 SNV Cal 81 0.944 0.043 Val 27 0.916 0.076 水分含量Water content 3 None Cal 83 0.990 0.337% Val 27 0.975 0.497% 可滴定酸Titration Acidity 7 SG(7, 2)+MSC Cal 81 0.821 3.22(mg·(100 g)−1) Val 24 0.783 3.20(mg·(100 g)−1) 脯氨酸Proline 4 SG(7, 3)+SNV Cal 71 0.614 53.87(mg·(100 g)−1) Val 20 0.530 54.95(mg·(100 g)−1) 淀粉酶值Diastase number 8 SNV Cal 81 0.618 3.387(mL·(g·h)−1) Val 26 0.641 3.248(mL·(g·h)−1) HMF 5 SG(7, 3)+SNV Cal 60 0.598 0.318(mg·(100 kg)−1) Val 19 0.241 0.440(mg·(100 kg)−1) 电导率Electrical Conductivity 14 SNV Cal 84 0.983 25.015(μS·cm) Val 24 0.935 49.27(μS·cm) 黏度Viscosity 9 SG(7, 3)+SNV Cal 79 0.980 0.403 Pa·s Val 27 0.949 0.662 Pa·s pH值 pH Value 13 SNV Cal 83 0.984 0.172 Val 27 0.947 0.321 色差L* Color L* 13 SG(7, 3)+SNV Cal 79 0.936 0.292 Val 27 0.819 0.471 色差a* Color a* 7 SNV+Autoscale Cal 78 0.898 0.101 Val 24 0.734 0.150 色差b* Color b* 11 MSC+Autoscale Cal 83 0.958 0.737 Val 27 0.850 1.343 注:SNV, 标准归一化; MSC, 多元散射校正; SG, 多项式平滑; D, 导数; Cal,校正集; Val, 验证集;C、P分别为Cal、Val的值。 Note:SNV, standard normal variate; MSC, multiplicative signal correction; SG, savitzky golay; D, derivative; Cal, calibration set; Val, validation set, C, P are value of Cal and Val. ![]() 图 3 果糖、葡萄糖、蔗糖、麦芽糖、还原糖、果糖/葡萄糖、水分PLSR模型预测值(NIR)和真实测量值散点图注:●:校正集; ▼: 验证集,下同。Figure 3. Scatter plot of fructose, glucose, sucrose, maltose, reducing sugars, fructose/glucose and water content between measured and predicted (NIR) values by PLSR modelsNote: ●: calibration set; ▼: validation set, the same below.
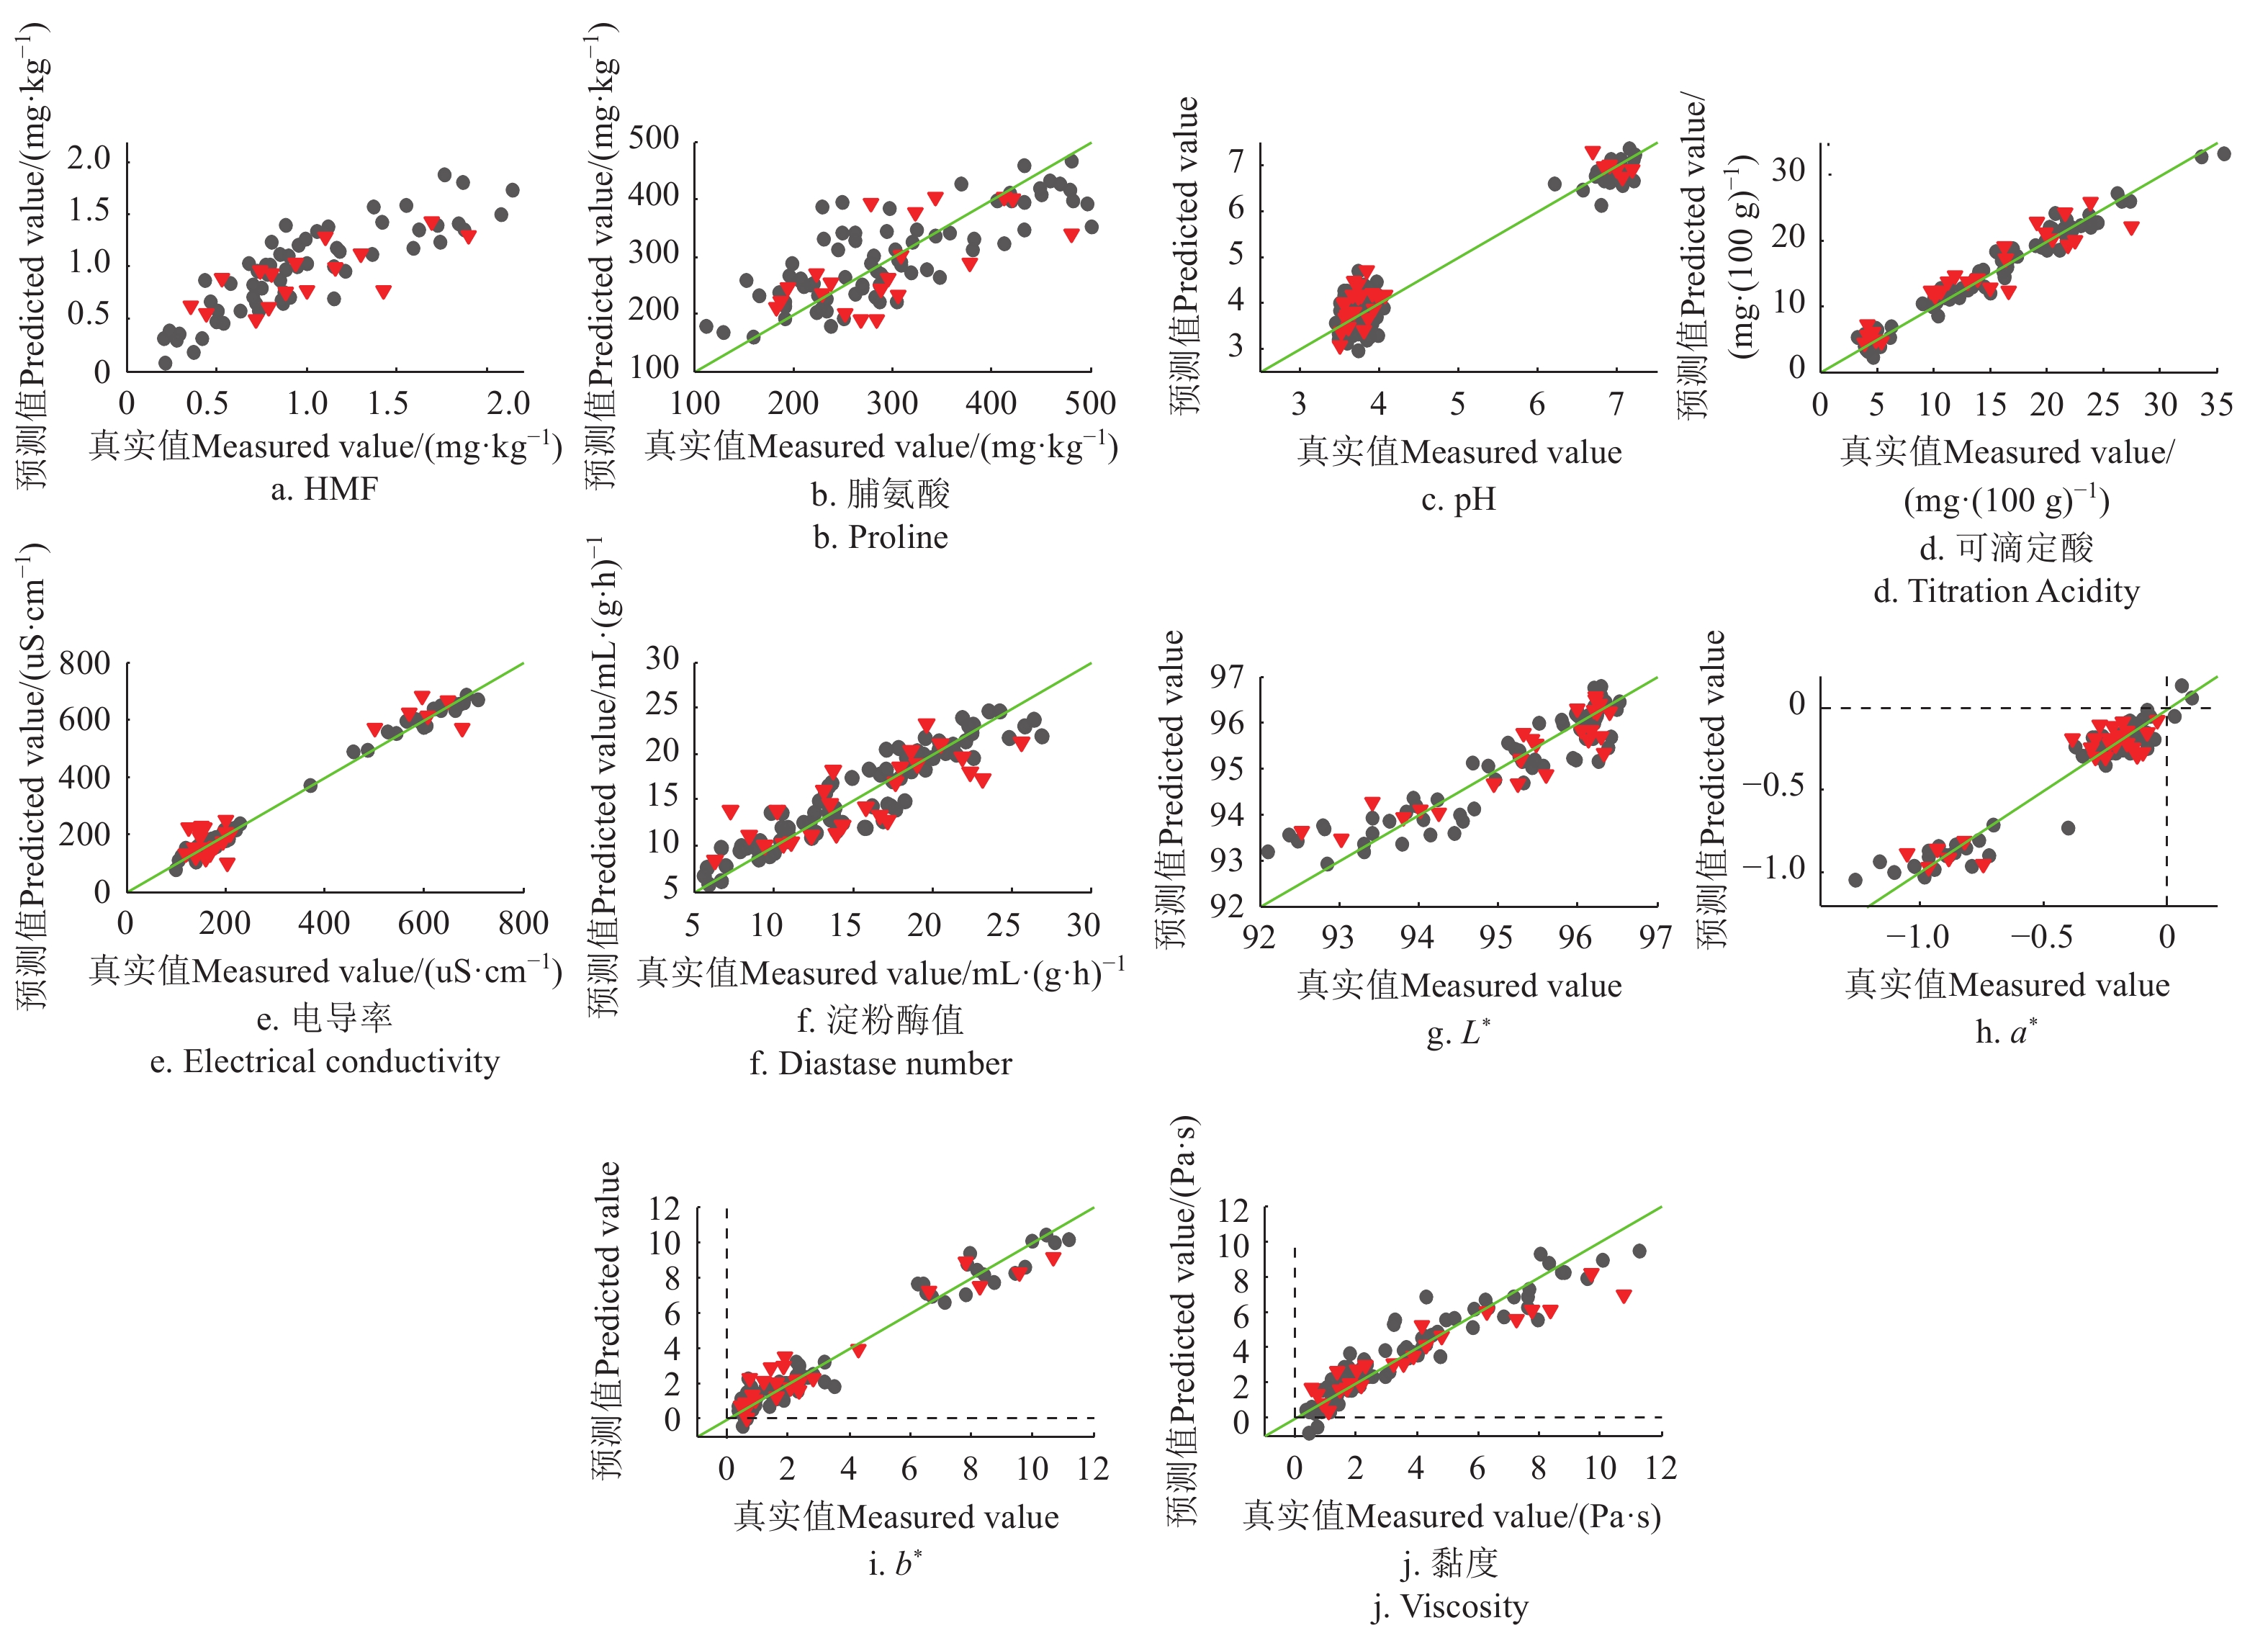
图 3 果糖、葡萄糖、蔗糖、麦芽糖、还原糖、果糖/葡萄糖、水分PLSR模型预测值(NIR)和真实测量值散点图注:●:校正集; ▼: 验证集,下同。Figure 3. Scatter plot of fructose, glucose, sucrose, maltose, reducing sugars, fructose/glucose and water content between measured and predicted (NIR) values by PLSR modelsNote: ●: calibration set; ▼: validation set, the same below.![]() 图 4 HMF、脯氨酸、pH值、可滴定酸、电导率、淀粉酶值、色差、黏度的PLSR模型预测值(NIR)和真实测量值散点图Figure 4. Scatter plot of HMF, proline, pH value, titration acidity, electrical conductivity, color and viscosity between measured and predicted (NIR) values by PLSR models
图 4 HMF、脯氨酸、pH值、可滴定酸、电导率、淀粉酶值、色差、黏度的PLSR模型预测值(NIR)和真实测量值散点图Figure 4. Scatter plot of HMF, proline, pH value, titration acidity, electrical conductivity, color and viscosity between measured and predicted (NIR) values by PLSR models由表3数据和散点图,建模集和预测集相关系数均大于0.9的指标为:果糖(RMSEP=1.123 g/100 g)、果糖/葡萄糖(RMSEP=0.043 g/100 g)、水分(RMSEP=0.497 %)、黏度(RMSEP=0.662 Pa·s)、pH值(RMSEP=0.321)、色差的L*(RMSEP=0.471)和a*(RMSEP=0.150),说明这些指标的模型精度和稳健性都较高。
电导率的相关系数很好,但模型的RMSEP为49.27 μS/cm,相较验证集的均值(268)数值较大,推断主要原因为数据值大小分布不均匀。葡萄糖、蔗糖、麦芽糖模型的相关性在0.6~0.85之间,RMSEP分别为1.559、0.126、3.742 g/100 g,综合考虑3个指标的均值、相关系数和RMSEP,认为PLS模型对这3个指标的预测结果可以接受,但模型精度稍差。
脯氨酸、淀粉酶值和HMF的模型相关系数和RMSEP结果显示,模型精度较差,预测结果可信度不够。
观察表3、1,比对蜂蜜各理化指标的测定数值的差值,该模型对果糖、葡萄糖、还原糖、果糖/葡萄糖、水分、黏度、pH值和色差具有良好的定量分析能力。对电导率、蔗糖、麦芽糖、可滴定酸,该模型的尚可以接受,模型精度能够用于快速定量分析。对淀粉酶值、脯氨酸和HMF,模型定量精度均不够。
2.4.2 中红外光谱PLSR模型
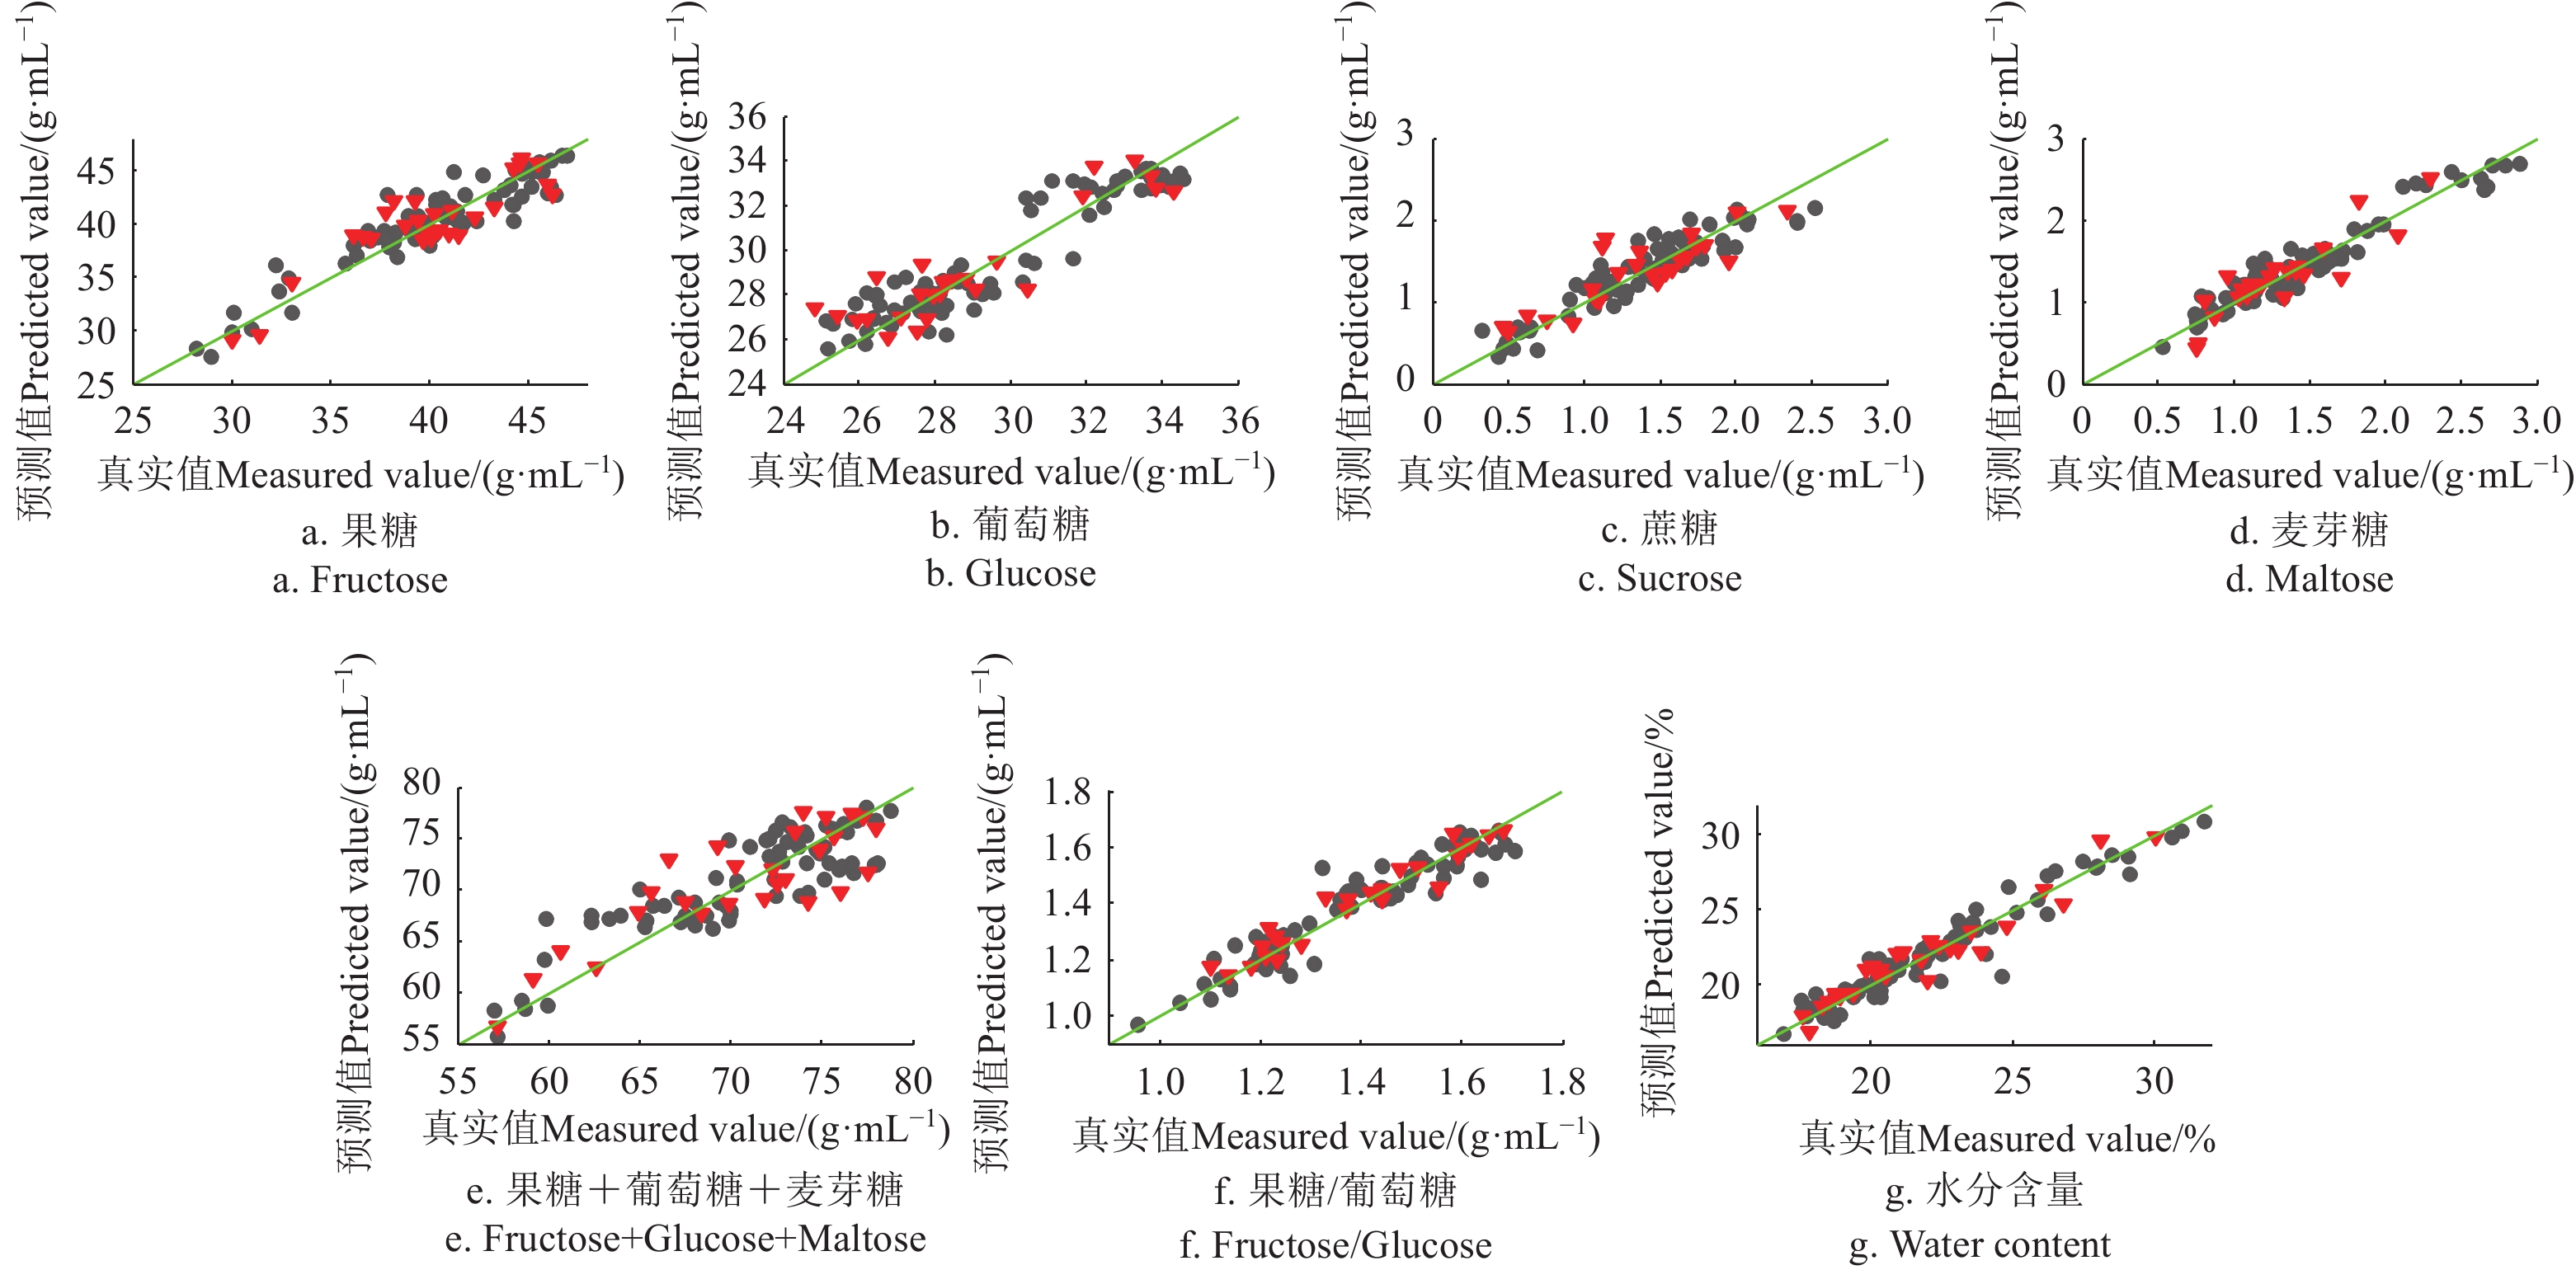
表4为本研究得到的理化值FTMIR-ATR检测的PLSR优化模型结果,图5、6为各项理化指标模型预测值(FTMIR-ATR)和真实测量值散点图。模型结果与NIR结果大体一致,对果糖、蔗糖、水分、电导率、黏度等结果理想,对脯氨酸、淀粉酶值和HMF的定量精度不够。
表 4 蜂蜜理化指标中红外光谱检测的偏最小二乘回归结果Table 4. PLSR model results for physical and chemical indicators determined by FTMIR-ATR测定指标
Measurand主成分的个数
PCs预处理方式
Pre-processing mode数据集
Date set样本数
Simple sizeR2 均方根误差
RMSE(C/P)果糖Fructose 5 SNV Cal 81 0.834 1.651(g·(100 mL)−1) Val 27 0.785 1.934(g·(100 mL)−1) 葡萄糖Glucose 7 None Cal 81 0.869 0.993(g·(100 mL)−1) Val 25 0.813 1.185(g·(100 mL)−1) 蔗糖Sucrose 6 SNV Cal 77 0.870 0.179(g·(100 mL)−1) Val 25 0.735 0.240(g·(100 mL)−1) 麦芽糖Maltose 4 SNV+Autoscale Cal 81 0.926 0.147(g·(100 mL)−1) Val 23 0.798 0.204(g·(100 mL)−1) 还原糖Reducing sugar 4 SG (7, 3)+SNV Cal 75 0.757 2.765(g·(100 mL)−1) Val 27 0.711 3.106(g·(100 mL)−1) 果糖/葡萄糖F/G 5 None Cal 83 0.905 0.056 Val 25 0.942 0.043 水分含量Water content 4 SNV Cal 84 0.932 0.883% Val 27 0.925 0.858% 可滴定酸Titration Acidity 9 MSC Cal 82 0.973 1.234(mg·(100 g)−1) Val 25 0.890 2.333(mg·(100 g)−1) 脯氨酸Proline 5 SG (7, 3)+SNV Cal 75 0.632 58.63(mg·(100 g)−1) Val 20 0.443 63.92(mg·(100 g)−1) 淀粉酶值Diastase number 3 2nd D (7,3) Cal 81 0.867 1.948(mL·(gh)−1) Val 26 0.641 3.033(mL·(gh)−1) HMF 4 1nd D (7,3) Cal 61 0.729 0.250(mg·(100 kg)−1) Val 16 0.555 0.291(mg·(100 kg)−1) 电导率Electrical conductivity 9 SNV Cal 82 0.993 16.35(μS·cm) Val 25 0.926 54.10(μS·cm) 黏度Viscosity 5 SNV Cal 74 0.895 0.880 Pa·s Val 23 0.907 1.225 Pa·s pH值 pH Value 6 2nd D (7,3)+SG (7, 3) Cal 79 0.938 0.350 Val 26 0.932 0.381 色差L* Color L* 3 1nd D (7,3)+SG (7, 3) Cal 77 0.860 0.449 Val 25 0.855 0.439 色差a* Color a* 6 Autoscale Cal 84 0.968 0.057 Val 27 0.914 0.114 色差b* Color b* 7 SNV Cal 79 0.958 0.620 Val 26 0.925 0.825 ![]() 图 5 果糖、葡萄糖、蔗糖、麦芽糖、还原糖、果糖/葡萄糖、水分PLSR模型预测值(FTMIR-ATR)和真实测量值散点图Figure 5. Scatter plot of fructose, glucose, sucrose, maltose, reducing sugars, fructose/glucose and water content between measured and predicted (FTMIR-ATR) values by PLSR models
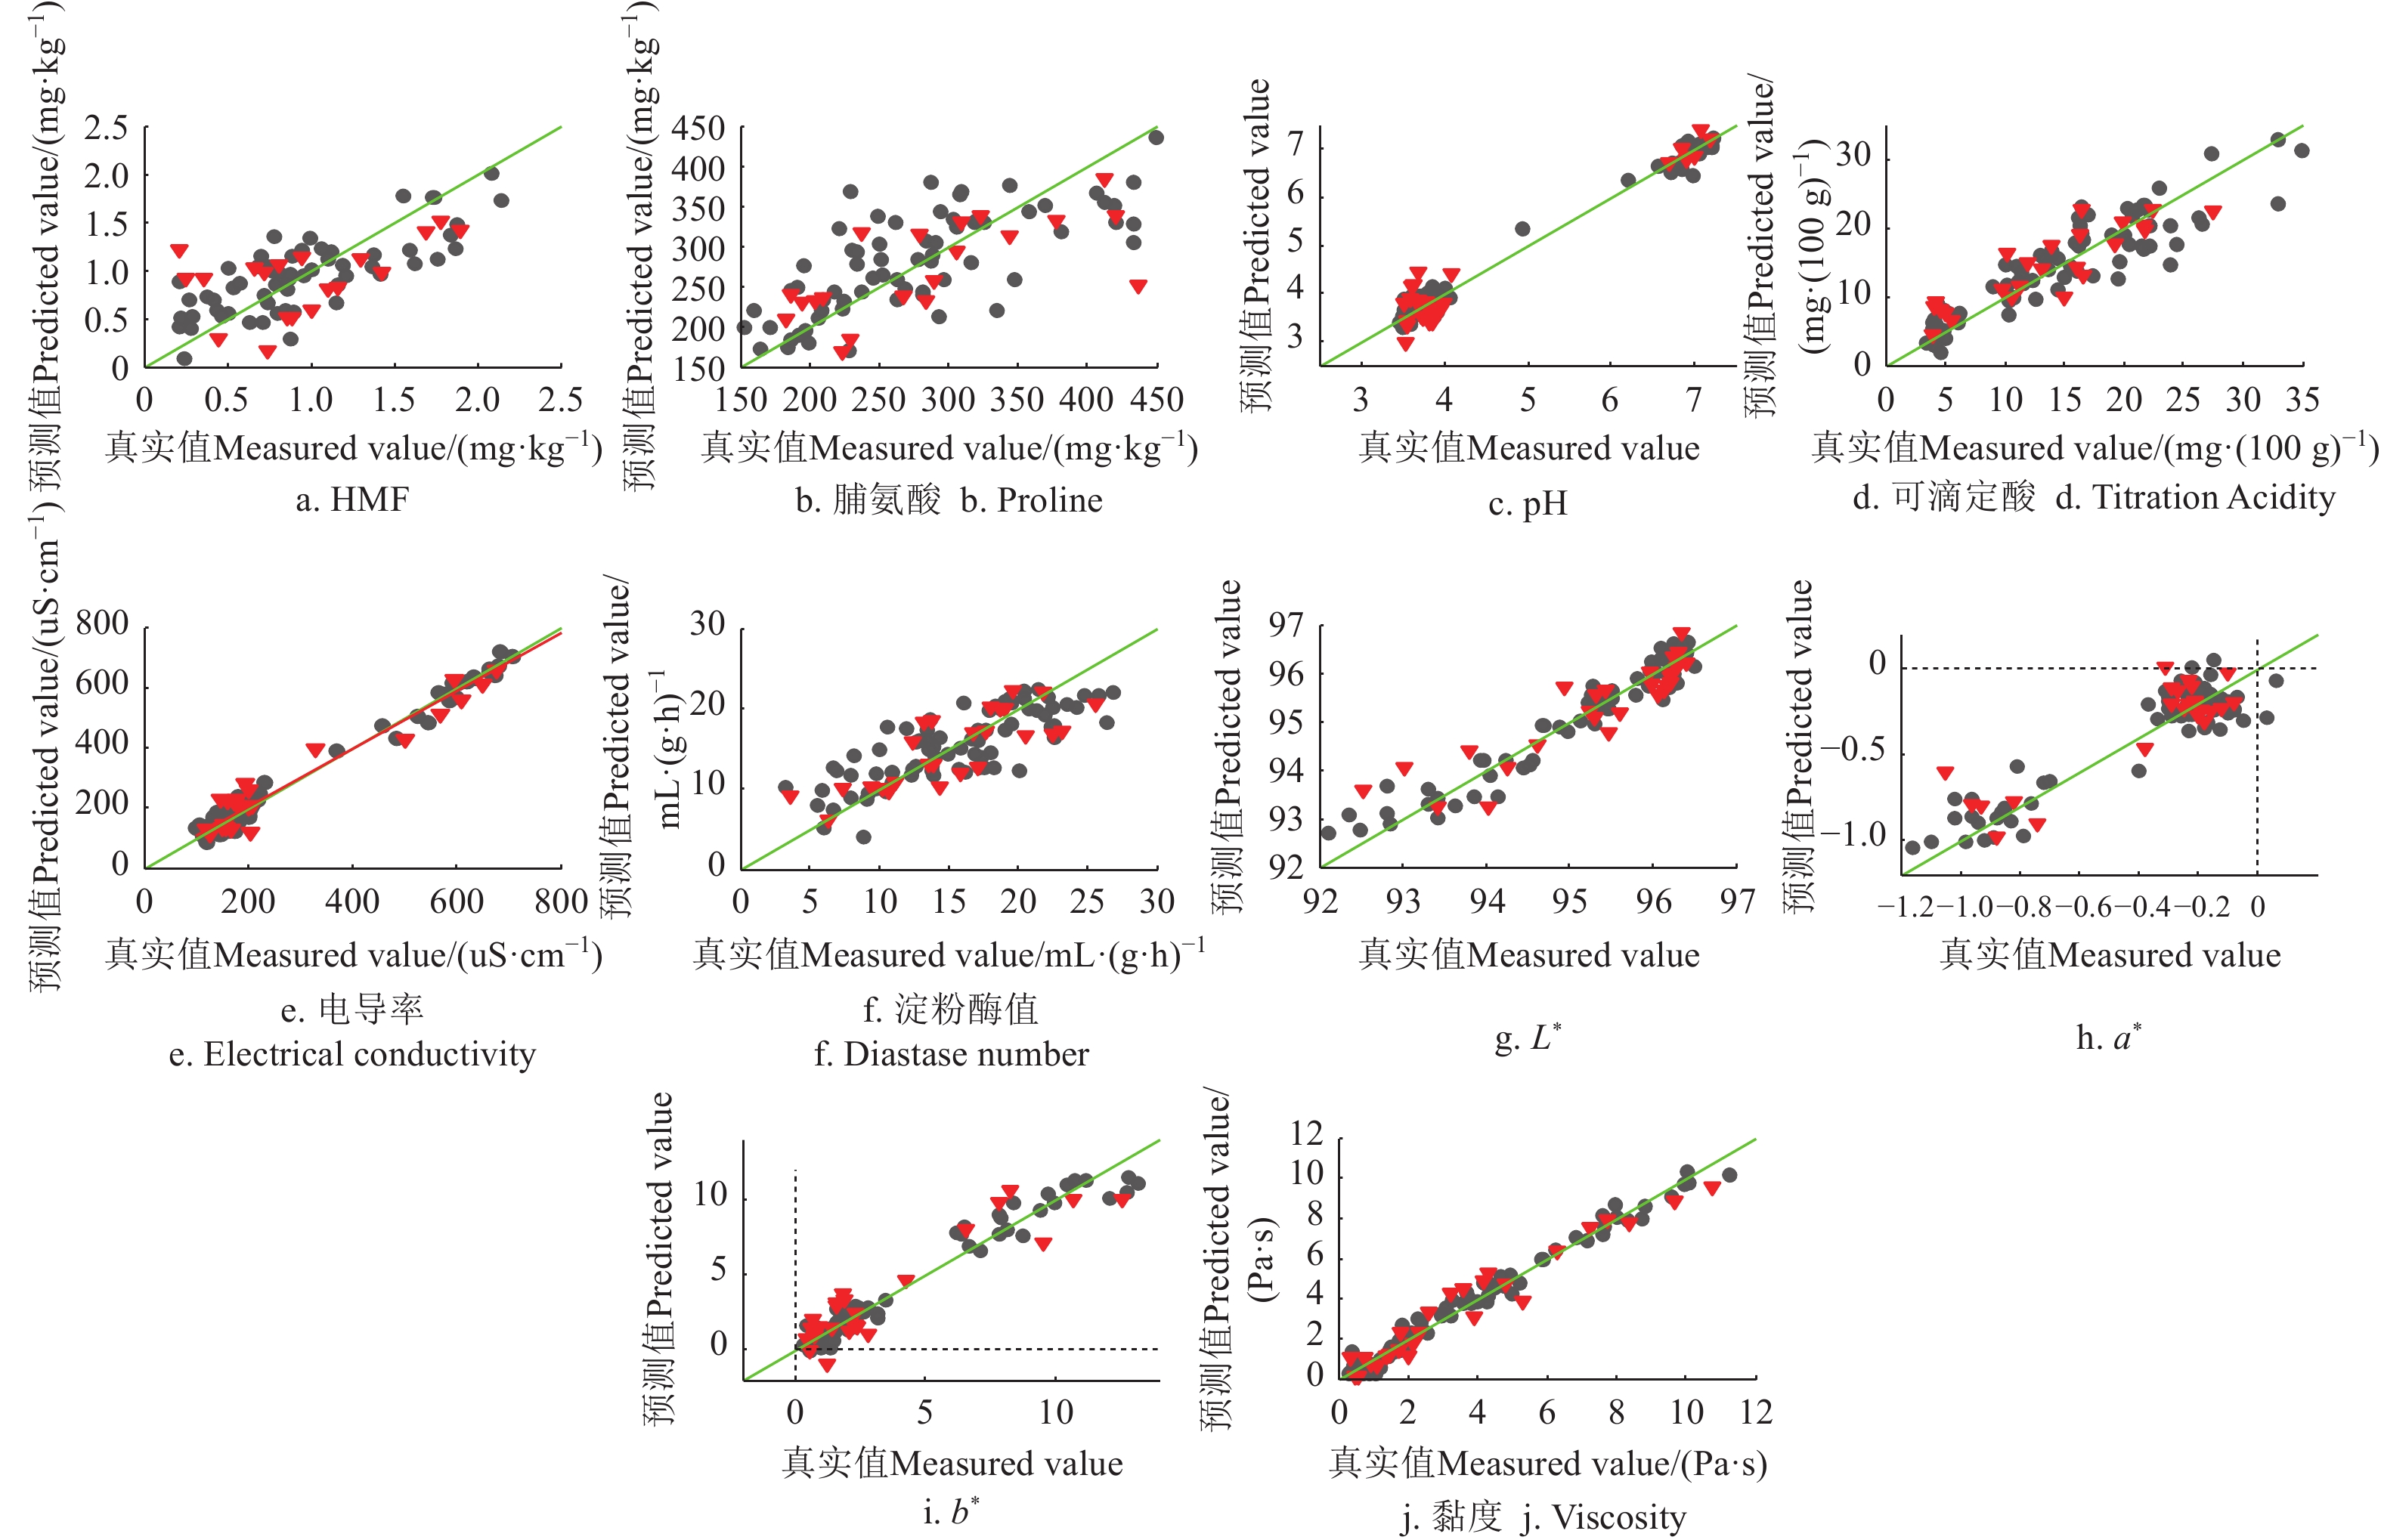
图 5 果糖、葡萄糖、蔗糖、麦芽糖、还原糖、果糖/葡萄糖、水分PLSR模型预测值(FTMIR-ATR)和真实测量值散点图Figure 5. Scatter plot of fructose, glucose, sucrose, maltose, reducing sugars, fructose/glucose and water content between measured and predicted (FTMIR-ATR) values by PLSR models![]() 图 6 羟甲基糠醛、脯氨酸、pH值、可滴定酸、电导率、淀粉酶值、色差、黏度的PLSR模型预测值(FTMIR-ATR)和真实测量值散点图Figure 6. Scatter plot of HMF, proline, pH, titration acidity, electrical conductivity, color and viscosity between measured and predicted (FTMIR-ATR) values by PLSR models
图 6 羟甲基糠醛、脯氨酸、pH值、可滴定酸、电导率、淀粉酶值、色差、黏度的PLSR模型预测值(FTMIR-ATR)和真实测量值散点图Figure 6. Scatter plot of HMF, proline, pH, titration acidity, electrical conductivity, color and viscosity between measured and predicted (FTMIR-ATR) values by PLSR models2.4.3 近、中红外光谱技术融合
对比单独使用NIR和MIR对脯氨酸、淀粉酶值的最优PLS定量模型的结果(见2.4.1和2.4.2):近红外对脯氨酸的定量(rc 0.614,rp 0.530,RMSEC 53.87 mg/kg,RMSEP 54.95 mg/kg);中红外淀粉酶值(rc 0.867,rp 0.641,RMSEC 1.94 mL/(g·h),RMSEP 3.03 mL/(g·h))。经融合后脯氨酸的定量略有提高(rc ,rp 0.664,RMSEC 38.68 mg/kg,RMSEP 49.57 mg/kg),而对淀粉酶值的定量精度没有提高(rc 0.799,rp 0.695,RMSEC 2.57 mL/(g·h),RMSEP 3.02 mL/(g·h))。可能有以下2种可能:1)淀粉酶值、脯氨酸等物质含量太少,糖和水的光谱吸收掩盖了其反映出的信息,可能这种定量效果已经是接近极限了。2)融合光谱不能进行更多的数据预处理,比如导数,所以一方面光谱融合增加了信息量,同时不能进行有效的数据预处理也损失了有效信息。
表 5 脯氨酸、淀粉酶值GAPLS定量分析结果Table 5. Results of GAPLS models predicting proline and diastase value指标
Index累计贡献率
Cumulative contribution rate CV /(%)交叉验证均方根误差
RMSECV变量数
Number of variables样本集
Sample set样本数
Sample size平均值
MeanR2 均方根误差
RMSE(C/P)脯氨酸
Proline95.71 0.206 70 校正 79 292 0.825 38.68/(mg·kg−1) 预测 27 286 0.664 49.57/(mg·kg−1) 淀粉酶值
Diastase number95.18 0.218 122 校正 81 14.52 0.799 2.57/(mL·(g·h)−1) 预测 26 15.25 0.695 3.02/(mL·(g·h)−1) 3. 讨 论
1)对近、中红外在蜂蜜理化性质的定量检测方面的能力进行比较。NIR预测精度更高的指标为:果糖(R2=0.908,RMSEP为1.123 g/100 g),蔗糖(R2=0.906,RMSEP为0.126 g/100 g),水分(R2=0.975,RMSEP为0.497%),电导率(R2=0.935,RMSEP为49.27 μS/cm),黏度(R2=0.949,RMSEP为0.662 Pa·s),pH值(R2=0.947,RMSEP为0.321)。MIR预测精度更高的指标为:葡萄糖(R2=0.813,RMSEP为1.185 g/100 g),麦芽糖(R2=0.798,RMSEP为0.204 g/100 g),还原糖(R2=0.711,RMSEP为3.106 g/100 g),果糖/葡萄糖(R2=0.942,RMSEP为0.043),可滴定酸(R2=0.890,RMSEP为2.333 mg/100 g)、淀粉酶值(R2=0.641,RMSEP为3.033 mL/>(g·h))和色差值(L*,a*,b*)。从总体来看,二者对脯氨酸、淀粉酶值的定量精度均不够,这与文献中报道的结果一致,普遍认为含量过低是主要原因。
比较二者使用的设备,NIR光谱采集使用的是液体光纤探头,MIR光谱采集使用的是ATR附件,ATR附件体积大、昂贵,受限于实验室使用。
2)对近、中红外信息进行融合,融合后的光谱数据只提高了脯氨酸的定量精度,并没有优化淀粉酶值的定量结果。目前,在数据融合过程中,还有很多需要解决的问题,比如明确什么类型的数据能够进行融合、融合数据时使用的算法、对融合数据进行处理的方法等。
4. 结 论
本研究以原料蜂蜜(枣花蜜、荆花蜜、洋槐蜜和油菜蜜)为对象,对蜂蜜指标间相关性进行分析,采用红外光谱(NIR、MIR)结合化学计量学研究蜂蜜综合理化性质(定量),建立理化性质定量检测的PLS模型,以相关系数(R2)、RMSEC、国标法检测数据等参数考察模型的稳健性和准确性,系统比较NIR、MIR定量能力,并考察技术融合的可行性。得到以下结论:
1)蜂蜜各指标具相关性,色差、电导率和pH值,三者之间两两正相关,pH值和可滴定酸,水分含量与黏度之间彼此呈负相关。
2)所建立模型对果糖、葡萄糖、还原糖、果糖/葡萄糖、水分、黏度、pH和色差数具有良好的定量分析能力(R2>0.9)。对电导率(R2=0.935)、蔗糖(R2=0.906)、麦芽糖(R2=0.798)、可滴定酸(R2=0.890),本研究建立模型的R2>0.7可以接受,模型精度能够用于快速定量分析,对脯氨酸、淀粉酶值和HMF的定量精度均较低(R2<0.7)。
针对不同的理化指标,NIR和MIR的定量能力各有所长;从仪器、附件和光谱采集模式角度上看,近红外光谱技术的光纤探头检测实际应用前景更好。
-
![]()
图 3 果糖、葡萄糖、蔗糖、麦芽糖、还原糖、果糖/葡萄糖、水分PLSR模型预测值(NIR)和真实测量值散点图
注:●:校正集; ▼: 验证集,下同。
Figure 3. Scatter plot of fructose, glucose, sucrose, maltose, reducing sugars, fructose/glucose and water content between measured and predicted (NIR) values by PLSR models
Note: ●: calibration set; ▼: validation set, the same below.
![]()
图 4 HMF、脯氨酸、pH值、可滴定酸、电导率、淀粉酶值、色差、黏度的PLSR模型预测值(NIR)和真实测量值散点图
Figure 4. Scatter plot of HMF, proline, pH value, titration acidity, electrical conductivity, color and viscosity between measured and predicted (NIR) values by PLSR models
![]()
图 5 果糖、葡萄糖、蔗糖、麦芽糖、还原糖、果糖/葡萄糖、水分PLSR模型预测值(FTMIR-ATR)和真实测量值散点图
Figure 5. Scatter plot of fructose, glucose, sucrose, maltose, reducing sugars, fructose/glucose and water content between measured and predicted (FTMIR-ATR) values by PLSR models
![]()
图 6 羟甲基糠醛、脯氨酸、pH值、可滴定酸、电导率、淀粉酶值、色差、黏度的PLSR模型预测值(FTMIR-ATR)和真实测量值散点图
Figure 6. Scatter plot of HMF, proline, pH, titration acidity, electrical conductivity, color and viscosity between measured and predicted (FTMIR-ATR) values by PLSR models
表 1 全部蜂蜜样品的物理化学指标检测结果描述
Table 1 Physical and chemical indicators description of all the honey samples
理化指标
Physicochemical index样本数
Sample number平均值
Average value标准偏差
Standard deviation最小值
Minimum value最大值
Maximum value果糖Fructose F/(g·(100 mL)−1) 116 39.546 4.776 19.634 47.000 葡萄糖Glucose G/(g·(100 mL)−1) 116 28.909 3.834 1.559 34.551 蔗糖Sucrose S/(g·(100 mL)−1) 116 1.487 0.719 0.329 4.402 麦芽糖Maltose M/(g·(100 mL)−1) 116 1.443 0.545 0.403 2.888 还原糖Reducing sugar RS/(g·(100 mL)−1) 116 69.89 7.51 21.97 78.83 果糖/葡萄糖Fructose/glucose F/G 116 1.469 1.057 0.958 12.590 淀粉酶值Diastase number DN/(mL·(g·h)−1) 115 15.32 5.25 5.59 26.90 羟甲基糠醛 HMF/(mg·kg−1) 118 0.749 0.597 − 2.607 电导率Electrical conductivity EC/(μS·cm−1) 118 265.11 185.39 100 708 pH值 pH value 118 4.43 1.34 3.46 7.22 水分Water content WC/(%) 118 21.94 3.274 16.940 31.768 可滴定酸Titration acidity TA/(mg·(100 g)−1) 118 15.097 7.584 3.347 34.886 黏度Viscosity V/(Pa·s) 118 3.724 3.180 0.254 16.455 脯氨酸Proline P/(mg·kg−1) 118 293.96 98.09 112 500 色差L* Color L* 115 95.29 1.13 92.10 96.53 色差a* Color a* 115 −0.358 0.318 −1.260 0.100 色差b* Color b* 115 3.356 3.519 0.363 13.165  下载: 导出CSV
表 2 理化指标间的相关系数矩阵
Table 2 Correlation matrixes of physical and chemical indicators
指标
IndicatorpH WC TA V P L* a* b* F G S M F/G RS HMF DN EC 0.97 −0.50 −0.67 0.63 0.39 −0.91 -0.94 0.95 −0.19 −0.29 0.57 −0.17 0.04 −0.30 −0.60 0.61 pH 1.00 −0.51 −0.79 0.60 0.35 −0.86 −0.96 0.92 −0.13 −0.39 0.64 −0.24 0.17 −0.31 −0.65 0.52 WC 1.00 0.59 −0.80 −0.52 0.57 0.51 −0.47 −0.42 −0.16 −0.61 −0.43 −0.25 −0.42 −0.06 −0.58 TA 1.00 −0.47 −0.25 0.55 0.78 −0.61 −0.28 0.43 −0.67 0.27 −0.54 0.03 0.45 −0.32 V 1.00 0.40 −0.65 −0.60 0.61 0.05 0.08 0.50 0.31 −0.01 0.10 −0.08 0.58 P 1.00 −0.52 −0.30 0.43 0.11 0.28 0.37 0.45 −0.10 0.26 0.07 0.62 L* 1.00 0.81 −0.97 0.17 0.10 −0.52 −0.05 0.07 0.17 0.44 −0.64 a* 1.00 −0.89 0.12 0.40 −0.63 0.27 −0.18 0.31 0.59 −0.48 b* 1.00 −0.24 −0.26 0.55 −0.12 −0.02 −0.32 −0.56 0.57 F 1.00 0.18 0.31 0.23 0.71 0.84 0.20 0.03 G 1.00 −0.29 0.68 −0.57 0.68 0.43 0.16 A 1.00 0.14 0.47 0.10 −0.26 0.35 M 1.00 −0.28 0.60 0.56 0.29 F/G 1.00 0.21 −0.14 −0.09 RS 1.00 0.41 0.13 HMF 1.00 −0.04
下载: 导出CSV
表 3 蜂蜜理化指标近红外光谱检测的偏最小二乘回归结果
Table 3 PLSR model results for physical and chemical indicators determined by FT-NIR
测定指标
Measurand主成分个数
Number of principal components PCs预处理方式
Pre-processing mode数据集
Date set样本数
Simple sizeR2 均方根误差
RMSE(C/P)果糖Fructose 13 SNV Cal 78 0.931 1.042(g·(100 mL)−1) Val 26 0.908 1.123(g·(100 mL)−1) 葡萄糖Glucose 9 SNV Cal 79 0.854 1.092(g·(100 mL)−1) Val 26 0.695 1.559(g·(100 mL)−1) 蔗糖Sucrose 13 2nd D(5, 5)+SNV Cal 76 0.883 0.157(g·(100 mL)−1) Val 25 0.906 0.126(g·(100 mL)−1) 麦芽糖Maltose 5 SNV Cal 77 0.642 0.320(g·(100 mL)−1) Val 26 0.612 0.346(g·(100 mL)−1) 还原糖Reducing sugar 4 SG(7, 3)+SNV Cal 82 0.688 3.243(g·(100 mL)−1) Val 27 0.414 3.742(g·(100 mL)−1) 果糖/葡萄糖 7 SNV Cal 81 0.944 0.043 Val 27 0.916 0.076 水分含量Water content 3 None Cal 83 0.990 0.337% Val 27 0.975 0.497% 可滴定酸Titration Acidity 7 SG(7, 2)+MSC Cal 81 0.821 3.22(mg·(100 g)−1) Val 24 0.783 3.20(mg·(100 g)−1) 脯氨酸Proline 4 SG(7, 3)+SNV Cal 71 0.614 53.87(mg·(100 g)−1) Val 20 0.530 54.95(mg·(100 g)−1) 淀粉酶值Diastase number 8 SNV Cal 81 0.618 3.387(mL·(g·h)−1) Val 26 0.641 3.248(mL·(g·h)−1) HMF 5 SG(7, 3)+SNV Cal 60 0.598 0.318(mg·(100 kg)−1) Val 19 0.241 0.440(mg·(100 kg)−1) 电导率Electrical Conductivity 14 SNV Cal 84 0.983 25.015(μS·cm) Val 24 0.935 49.27(μS·cm) 黏度Viscosity 9 SG(7, 3)+SNV Cal 79 0.980 0.403 Pa·s Val 27 0.949 0.662 Pa·s pH值 pH Value 13 SNV Cal 83 0.984 0.172 Val 27 0.947 0.321 色差L* Color L* 13 SG(7, 3)+SNV Cal 79 0.936 0.292 Val 27 0.819 0.471 色差a* Color a* 7 SNV+Autoscale Cal 78 0.898 0.101 Val 24 0.734 0.150 色差b* Color b* 11 MSC+Autoscale Cal 83 0.958 0.737 Val 27 0.850 1.343 注:SNV, 标准归一化; MSC, 多元散射校正; SG, 多项式平滑; D, 导数; Cal,校正集; Val, 验证集;C、P分别为Cal、Val的值。 Note:SNV, standard normal variate; MSC, multiplicative signal correction; SG, savitzky golay; D, derivative; Cal, calibration set; Val, validation set, C, P are value of Cal and Val.
下载: 导出CSV
表 4 蜂蜜理化指标中红外光谱检测的偏最小二乘回归结果
Table 4 PLSR model results for physical and chemical indicators determined by FTMIR-ATR
测定指标
Measurand主成分的个数
PCs预处理方式
Pre-processing mode数据集
Date set样本数
Simple sizeR2 均方根误差
RMSE(C/P)果糖Fructose 5 SNV Cal 81 0.834 1.651(g·(100 mL)−1) Val 27 0.785 1.934(g·(100 mL)−1) 葡萄糖Glucose 7 None Cal 81 0.869 0.993(g·(100 mL)−1) Val 25 0.813 1.185(g·(100 mL)−1) 蔗糖Sucrose 6 SNV Cal 77 0.870 0.179(g·(100 mL)−1) Val 25 0.735 0.240(g·(100 mL)−1) 麦芽糖Maltose 4 SNV+Autoscale Cal 81 0.926 0.147(g·(100 mL)−1) Val 23 0.798 0.204(g·(100 mL)−1) 还原糖Reducing sugar 4 SG (7, 3)+SNV Cal 75 0.757 2.765(g·(100 mL)−1) Val 27 0.711 3.106(g·(100 mL)−1) 果糖/葡萄糖F/G 5 None Cal 83 0.905 0.056 Val 25 0.942 0.043 水分含量Water content 4 SNV Cal 84 0.932 0.883% Val 27 0.925 0.858% 可滴定酸Titration Acidity 9 MSC Cal 82 0.973 1.234(mg·(100 g)−1) Val 25 0.890 2.333(mg·(100 g)−1) 脯氨酸Proline 5 SG (7, 3)+SNV Cal 75 0.632 58.63(mg·(100 g)−1) Val 20 0.443 63.92(mg·(100 g)−1) 淀粉酶值Diastase number 3 2nd D (7,3) Cal 81 0.867 1.948(mL·(gh)−1) Val 26 0.641 3.033(mL·(gh)−1) HMF 4 1nd D (7,3) Cal 61 0.729 0.250(mg·(100 kg)−1) Val 16 0.555 0.291(mg·(100 kg)−1) 电导率Electrical conductivity 9 SNV Cal 82 0.993 16.35(μS·cm) Val 25 0.926 54.10(μS·cm) 黏度Viscosity 5 SNV Cal 74 0.895 0.880 Pa·s Val 23 0.907 1.225 Pa·s pH值 pH Value 6 2nd D (7,3)+SG (7, 3) Cal 79 0.938 0.350 Val 26 0.932 0.381 色差L* Color L* 3 1nd D (7,3)+SG (7, 3) Cal 77 0.860 0.449 Val 25 0.855 0.439 色差a* Color a* 6 Autoscale Cal 84 0.968 0.057 Val 27 0.914 0.114 色差b* Color b* 7 SNV Cal 79 0.958 0.620 Val 26 0.925 0.825
下载: 导出CSV
表 5 脯氨酸、淀粉酶值GAPLS定量分析结果
Table 5 Results of GAPLS models predicting proline and diastase value
指标
Index累计贡献率
Cumulative contribution rate CV /(%)交叉验证均方根误差
RMSECV变量数
Number of variables样本集
Sample set样本数
Sample size平均值
MeanR2 均方根误差
RMSE(C/P)脯氨酸
Proline95.71 0.206 70 校正 79 292 0.825 38.68/(mg·kg−1) 预测 27 286 0.664 49.57/(mg·kg−1) 淀粉酶值
Diastase number95.18 0.218 122 校正 81 14.52 0.799 2.57/(mL·(g·h)−1) 预测 26 15.25 0.695 3.02/(mL·(g·h)−1)
下载: 导出CSV
-
[1] 王琪琦,杜欣玥,高西贝,等. 蜂蜜功能活性及药用价值研究进展[J]. 食品安全质量检测学报,2022,13(18):5849-5854. WANG Qiqi, DU Xinyue, GAO Xibei, et al. Research progress on functional activity and medicinal value of honey[J]. Journal of Food Safety and Quality Inspection, 2022, 13(18): 5849-5854. (in Chinese with English abstract DOI: 10.19812/j.cnki.jfsq11-5956/ts.2022.18.014 WANG Qiqi, DU Xinyue, GAO Xibei, et al. Research progress on functional activity and medicinal value of honey [J]. Journal of Food Safety and Quality Inspection, 202, 13(18) : 5849-5854. (in Chinese with English abstract) DOI: 10.19812/j.cnki.jfsq11-5956/ts.2022.18.014
[2] 裴高璞, 史波林, 赵镭, 等. 典型掺假蜂蜜的电子鼻信息变化特征及判别能力[J]. 农业工程学报, 2015, 31(增刊1): 325-331. PEI Gaopu, SHI Bolin, ZHAO Lei, et al. Change characteristics and discrimination ability of electronic nose information of typical adulterated honey [J]. Transactions of the Chinese Society of Agricultural Engineering(Transactions of the CSAE), 2015, 31(Supp. 1): 325-331.
[3] KOCYIGIT A, GULER E M, KALELI S. Anti-inflammatory and antioxidative properties of honey bee venom on Freund's Complete Adjuvant-induced arthritis model in rats[J]. Toxicon, 2019, 161: 4-11. DOI: 10.1016/j.toxicon.2019.02.016
[4] MAJTAN J, BUCEKOVA M, KAFANTARIS I, et al. Honey antibacterial activity: A neglected aspect of honey quality assurance as functional food[J]. Trends in Food Science & Technology, 2021, 118: 870-886.
[5] 汪思凡,曹振辉,潘洪彬,等. 蜂蜜化学成分及其主要生物学功能研究进展[J]. 食品研究与开发,2018,39(1):176-181. WANG Sifan, CAO Zhenhui, PAN Hongbin, et al. Research progress of chemical constituents and main biological functions of honey[J]. Food Research and Development, 2018, 39(1): 176-181. (in Chinese with English abstract DOI: 10.3969/j.issn.1005-6521.2018.01.035 WANG Sifan, CAO Zhenhui, PAN Hongbin, et al. Research progress of chemical constituents and main biological functions of honey [J]. Food Research and Development, 2018, 39 (1) : 176-181. (in Chinese with English abstract) DOI: 10.3969/j.issn.1005-6521.2018.01.035
[6] CHEN H, NIE Q, XIE M, et al. Protective effects of β-glucan isolated from highland barley on ethanol-induced gastric damage in rats and its benefits to mice gut conditions[J]. Food research international, 2019, 122: 157-166. DOI: 10.1016/j.foodres.2019.04.011
[7] ZHAO H, CHENG N, ZHOU W, et al. Honey polyphenols ameliorate DSS‐induced ulcerative colitis via modulating gut microbiota in rats[J]. Molecular nutrition & food research, 2019, 63(23): 1900638.
[8] CÁRDENAS-ESCUDERO J, GALÁN-MADRUGA D, CÁCERES J O. Rapid, reliable and easy-to-perform chemometric-less method for rice syrup adulterated honey detection using FTIR-ATR[J]. Talanta, 2023, 253: 123961. DOI: 10.1016/j.talanta.2022.123961
[9] QIAO J, CHEN L, KONG L, et al. Characteristic components and authenticity evaluation of rape, acacia, and linden honey[J]. Journal of Agricultural and Food Chemistry, 2020, 68(36): 9776-9788. DOI: 10.1021/acs.jafc.0c05070
[10] HIXON K R, KLEIN R C, EBERLIN C T, et al. A critical review and perspective of honey in tissue engineering and clinical wound healing[J]. Advances in Wound Care, 2019, 8(8): 403-415. DOI: 10.1089/wound.2018.0848
[11] SAMAT S, KANYAN E F, NOR F, et al. Four-week consumption of Malaysian honey reduces excess weight gain and improves obesity-related parameters in high fat diet induced obese rats[J]. Evidence-based Complementary and Alternative Medicine, 2017, 2017: 1342150.
[12] BOBIŞ O, DEZMIREAN D S, MOISE A R. Honey and diabetes: the importance of natural simple sugars in diet for preventing and treating different type of diabetes[J]. Oxidative Medicine and Cellular Longevity, 2018, 2018: 4757893.
[13] 齐宁馨. 蜂蜜标准及法规[J]. 中国蜂业,2022,73(8):45-50. QI Ningxin. Honey standards and regulations[J]. Apiculture of China, 2022, 73(8): 45-50. (in Chinese with English abstract DOI: 10.3969/j.issn.0412-4367.2022.08.021 QI Ningxin. Honey standards and regulations [J]. Apiculture of China, 2022, 73 (8) : 45-50. (in Chinese with English abstract) DOI: 10.3969/j.issn.0412-4367.2022.08.021
[14] 张梦璐,张国权. 红外光谱技术在食品检测中的应用[J]. 中国食品,2021,38(7):95. ZHANG Menglu, ZHANG Guoquan. Application of infrared spectroscopy in food detection[J]. China Food, 2021, 38(7): 95. (in Chinese with English abstract DOI: 10.3969/j.issn.1000-1085.2021.07.054 ZHANG Menglu, ZHANG Guoquan. Application of infrared spectroscopy in food detection [J]. China Food, 2021(7) : 95. (in Chinese with English abstract) DOI: 10.3969/j.issn.1000-1085.2021.07.054
[15] LI X, WU Z, FENG X, et al. Quality-by-Design: Multivariate model for multicomponent quantification in refining process of honey[J]. Pharmacognosy Magazine, 2017, 13(49): 193. DOI: 10.4103/0973-1296.196310
[16] APRICENO A, BUCCI R, GIRELLI A M, et al. 5-Hydroxymethyl furfural determination in Italian honeys by a fast near infrared spectroscopy[J]. Microchemical Journal, 2018, 143: 140-144. DOI: 10.1016/j.microc.2018.07.038
[17] 丁家欣,张秋海,李树莉,等. 应用近红外光谱法快速测定蜂蜜中葡萄糖和果糖含量[J]. 光谱学与光谱分析,2016,36(S1):197-198. DING Jiaxin, ZHANG Qiuhai, LI Shuli, et al. Rapid determination of glucose and fructose in honey by near infrared spectroscopy[J]. Spectroscopy and Spectral Analysis, 2016, 36(S1): 197-198. (in Chinese with English abstract DING Jiaxin, ZHANG Qiuhai, LI Shuli, et al. Rapid determination of glucose and fructose in honey by near infrared spectroscopy [J]. Spectroscopy and Spectral Analysis, 2016, 36 (S1) : 197-198. (in Chinese with English abstract)
[18] LI Q, ZENG J, LIN L, et al. Mid-infrared spectra feature extraction and visualization by convolutional neural network for sugar adulteration identification of honey and real-world application[J]. LWT-Food Science & Technology, 2021, 140: 110856. DOI: 10.1016/j.lwt.2021.110856
[19] ÖZBAY M, ARSLAN F N, GÖRÜR G. Qualitative and quantitative detection of monofloral, polyfloral, and honeydew honeys adulteration by employing mid-Infrared spectroscopy and chemometrics[J]. Food Analytical Methods, 2022, 15(8): 2274-2289. DOI: 10.1007/s12161-022-02266-7
[20] ZHANG X, DAI X, ZHANG X, et al. Joint principal component analysis and total variation for infrared and visible image fusion[J]. Infrared Physics & Technology, 2023, 128: 104523.
[21] KINEBER A F, OKE A E, HAMED M M, et al. Modeling the impact of overcoming the green walls implementation barriers on sustainable building projects: A novel mathematical partial least squares-SEM method[J]. Mathematics, 2023, 11(3): 504. DOI: 10.3390/math11030504
[22] 中华人民共和国卫生部. 食品安全国家标准 蜂蜜: GB 14963-2011[S]. 北京: 标准出版社. [23] BOGDANOV S, RUOFF K, ODDO L P. Physico-chemical methods for the characterisation of unifloral honeys: A review[J]. Apidologie, 2004, 35(Suppl.1): 4-17.
[24] BOGDANOV S, MARTIN P, LULLMANN C. Harmonised methods of the international honey commission[J]. Swiss Bee Research Centre, FAM, Liebefeld, 2002, 5: 1-62.
[25] 国家食品药品监督管理局. 食品安全国家标准 食品中果糖、葡萄糖、蔗糖、麦芽糖、乳糖的测定: GB 5009.8-2016[S]. 北京: 中国标准出版社, 2016. [26] 国家出入境检验检疫局. 进出口蜂蜜检验规程: SN/T 0852-2012[S]. 北京: 中国标准出版社, 2012. [27] 中华人民共和国国家质量监督检验检疫总局. 蜂蜜电导率测定方法:GB/T 18932.15-2003[S]. 北京: 中国标准出版社, 2003. [28] 中华人民共和国国家质量监督检验检疫总局. 蜂蜜中淀粉酶值的测定方法 分光光度法:GB/T 18932.16-2003[S]. 北京: 中国标准出版社, 2003. [29] 中华人民共和国国家质量监督检验检疫总局. 蜂蜜中羟甲基糠醛含量的测定方法 液相色谱-紫外检测法:[S]. 北京: 标准出版社 [30] 张岩,马光路,杨志杰. 不同溶剂提取-分光光度法测定蜂蜜中脯氨酸含量[J]. 黑龙江畜牧兽医,2017(15):278-280. ZHANG Yan, MA Guanglu, YANG Zhijie. Spectrophotometric method using different solvents extraction, proline content in honey[J]. Journal of Animal Husbandry and Veterinary in Heilongjiang Province, 2017(15): 278-280. (in Chinese with English abstract DOI: 10.13881/j.cnki.hljxmsy.2017.1387 ZHANG Yan, MA Guanglu, YANG Zhijie. Spectrophotometric method using different solvents extraction, proline content in honey [J]. Journal of animal husbandry and veterinary in heilongjiang province, 2017 (15) : 278-280. TheDOI: 10.13881 / j.carol carroll nki hljxmsy. 2017.1387.
[31] 李浩光,于云华,逄燕,等. 基于遗传算法的近红外光谱定性分析特征波长提取方法研究[J]. 光谱学与光谱分析,2437,41(8):2437-2442. LI Haoguang, YU Yunhua, PANG Yan, et al. Research on feature wavelength extraction method of near infrared spectral qualitative analysis based on genetic algorithm[J]. Spectroscopy and Spectral Analysis,, 2437, 41(8): 2437-2442. (in Chinese with English abstract LI Haoguang, YU Yunhua, PANG Yan, et al. Research on Feature Wavelength Extraction Method of near infrared spectral Qualitative Analysis Based on Genetic Algorithm [J]. Spectroscopy and Spectral Analysis, 201, 41(8) : 2437-2442. (in Chinese with English abstract)
[32] ZHANG Y, SONG Y, ZHOU T, et al. Kinetics of 5-hydroxymethylfurfural formation in chinese acacia honey during heat treatment[J]. Food Science and Biotechnology, 2012, 21: 1627-1632. DOI: 10.1007/s10068-012-0216-9
[33] 罗红霞,王丽,李淑荣. 10种蜂蜜中的抗氧化物质及其抗氧化能力分析[J]. 食品安全质量检测学报,2015,6(2):626-632. LUO Hongxia, WANG Li, LI Shurong. Analysis of antioxidant substances and their antioxidant capacity in 10 kinds of honey[J]. Journal of Food Safety and Quality Inspection, 2015, 6(2): 626-632. (in Chinese with English abstract LUO Hongxia, WANG Li, LI Shurong. Analysis of antioxidant substances and their antioxidant capacity in 10 kinds of honey [J]. Journal of Food Safety and Quality Inspection, 2015, 6 (02): 626-632. (in Chinese with English abstract)
[34] 张洪礼,王伦兴,陈德琴,等. 蜂蜜化学成分及其生物活性的研究进展[J]. 贵州农业科学,2021,49(9):100-107. ZHANG Hongli, WANG Lunxing, CHEN Deqin, et al. Research progress on chemical constituents and biological activities of honey[J]. Journal of Guizhou Agricultural Sciences, 2021, 49(9): 100-107. (in Chinese with English abstract ZHANG Hongli, WANG Lunxing, CHEN Deqin, et al. Research progress on chemical constituents and biological activities of honey [J]. Journal of Guizhou Agricultural Sciences, 2021, 49 (09) : 100-107. (in Chinese with English abstract)
[35] 杨娟. 基于多种光谱技术的蜂蜜和蜂胶品种鉴别研究[D]. 北京: 中国农业科学院, 2016. YANG Juan. Identification of Honey and Propolis Varieties Based on Multiple Spectral Techniques [D]. Beijing: Chinese Academy of Agricultural Sciences, 2016. (in Chinese with English abstract)
-
期刊类型引用(3)
1. 苏婷婷,蔡健志,姜卓兵,欧阳蕾. 蜂蜜理化性质快速检测中红外光谱技术运用分析. 实验室检测. 2025(01): 131-133 .  百度学术
百度学术
2. 许方方,刘丽娜,李顺峰,崔国梅,王安建. 高效瞬时灭菌技术对平菇栽培基质的影响. 中国瓜菜. 2024(07): 144-148 . 百度学术
3. 裴莉昕,何江龙,王锴乐,纪宝玉. 基于傅里叶变换红外光谱技术与多元统计分析相结合的中药葛根快速定量研究. 化学研究与应用. 2024(09): 1988-1996 . 百度学术
其他类型引用(1)
计量
- 文章访问数: 97
- HTML全文浏览量: 0
- PDF下载量: 100
- 被引次数: 4
 下载:
下载: